- United Kingdom
- /
- Luxury
- /
- LSE:BRBY
M.P. Evans Group And Two More Top UK Dividend Stocks

Reviewed by Simply Wall St

The United Kingdom's stock market has recently experienced a downturn, influenced by disappointing trade data from China and its broader economic challenges. This context underscores the importance of focusing on fundamentally strong dividend stocks like M.P. Evans Group, which can offer investors potential stability and regular income streams during uncertain times.
Top 10 Dividend Stocks In The United Kingdom
| Name | Dividend Yield | Dividend Rating |
| James Latham (AIM:LTHM) | 5.77% | ★★★★★★ |
| Big Yellow Group (LSE:BYG) | 3.87% | ★★★★★☆ |
| Keller Group (LSE:KLR) | 3.05% | ★★★★★☆ |
| Rio Tinto Group (LSE:RIO) | 6.71% | ★★★★★☆ |
| Plus500 (LSE:PLUS) | 5.85% | ★★★★★☆ |
| DCC (LSE:DCC) | 3.71% | ★★★★★☆ |
| Dunelm Group (LSE:DNLM) | 6.42% | ★★★★★☆ |
| Hargreaves Services (AIM:HSP) | 6.19% | ★★★★★☆ |
| NWF Group (AIM:NWF) | 4.59% | ★★★★★☆ |
| Grafton Group (LSE:GFTU) | 3.54% | ★★★★★☆ |
Click here to see the full list of 55 stocks from our Top UK Dividend Stocks screener.
Let's review some notable picks from our screened stocks.
M.P. Evans Group (AIM:MPE)
Simply Wall St Dividend Rating: ★★★★☆☆
Overview: M.P. Evans Group PLC operates oil palm plantations in Indonesia and Malaysia, with a market capitalization of approximately £457.70 million.
Operations: M.P. Evans Group PLC generates revenue primarily from its plantation operations in Indonesia, amounting to $307.32 million.
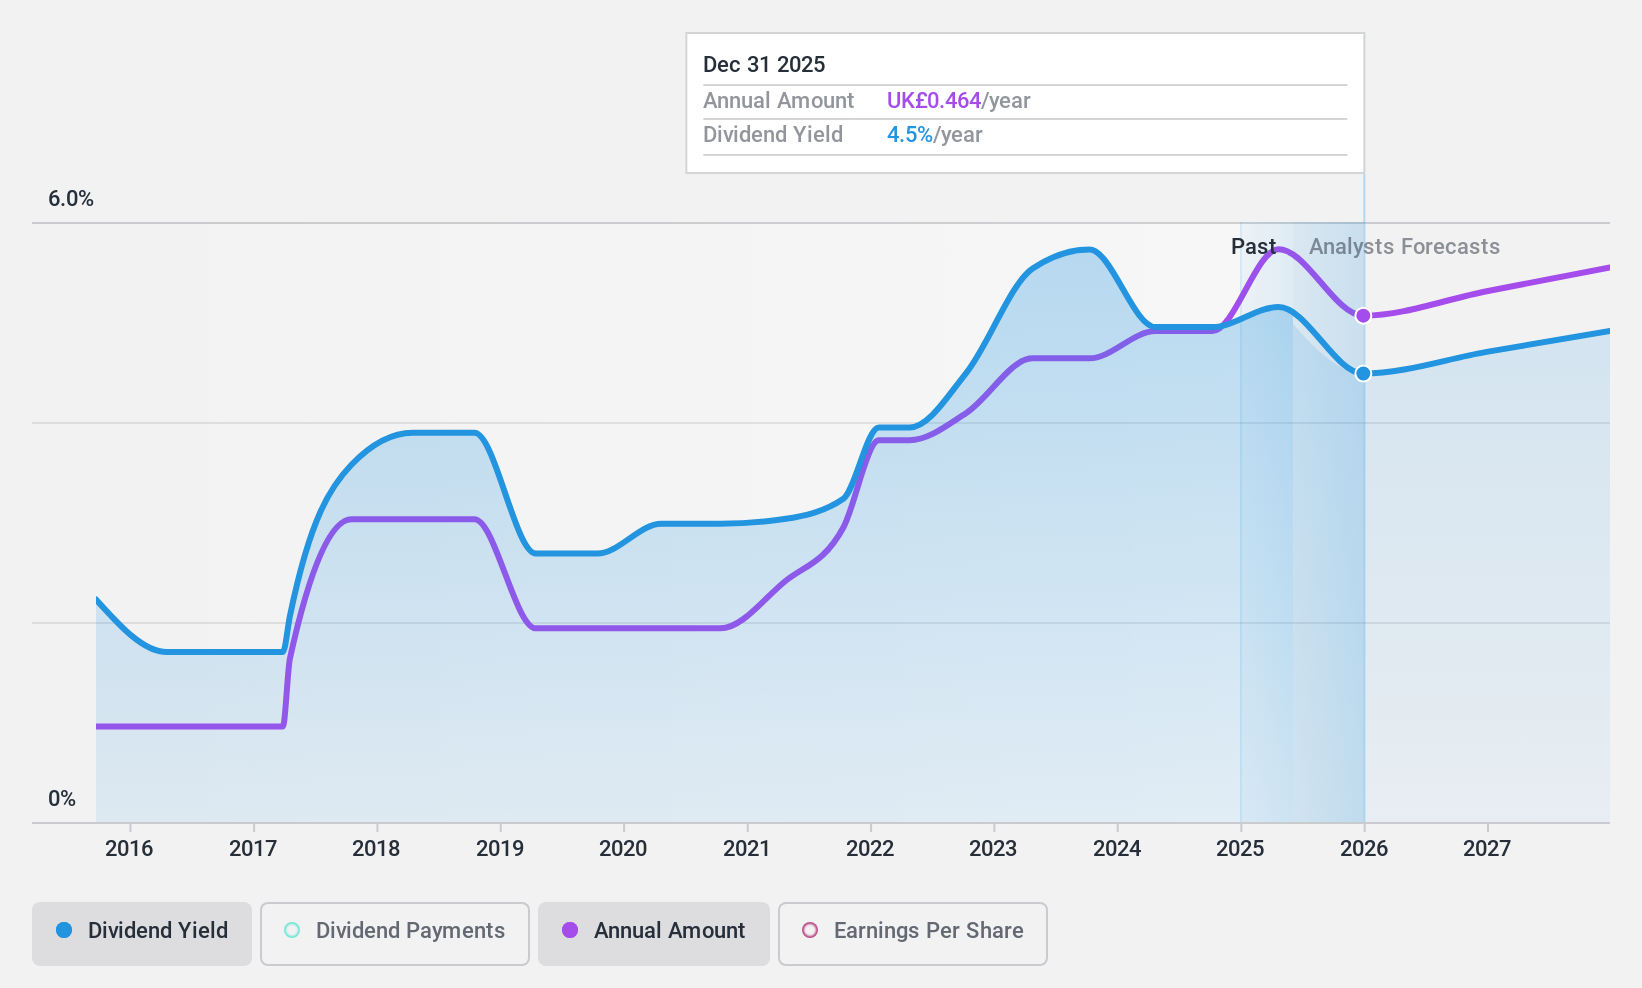
Dividend Yield: 5%
M.P. Evans Group, despite a volatile dividend history over the past decade, maintains a dividend yield of 4.95%, which is modest relative to the UK market's top performers. The company recently announced share repurchases and an operational uptick with a 10% increase in crude palm oil production from last year, signaling potential financial stability. Dividends appear sustainable with earnings and cash flows covering payouts at ratios of 58.7% and 64.5%, respectively, though its stock trades at a significant discount to estimated fair value, suggesting undervaluation or investor caution regarding its growth prospects.
- Take a closer look at M.P. Evans Group's potential here in our dividend report.
- Our valuation report here indicates M.P. Evans Group may be undervalued.
Burberry Group (LSE:BRBY)
Simply Wall St Dividend Rating: ★★★★★☆
Overview: Burberry Group plc operates in the luxury goods sector, manufacturing, retailing, and wholesaling products under the Burberry brand with a market capitalization of approximately £2.57 billion.
Operations: Burberry Group's primary revenue is generated from its retail and wholesale operations, amounting to £2.91 billion, with an additional £63 million from licensing.
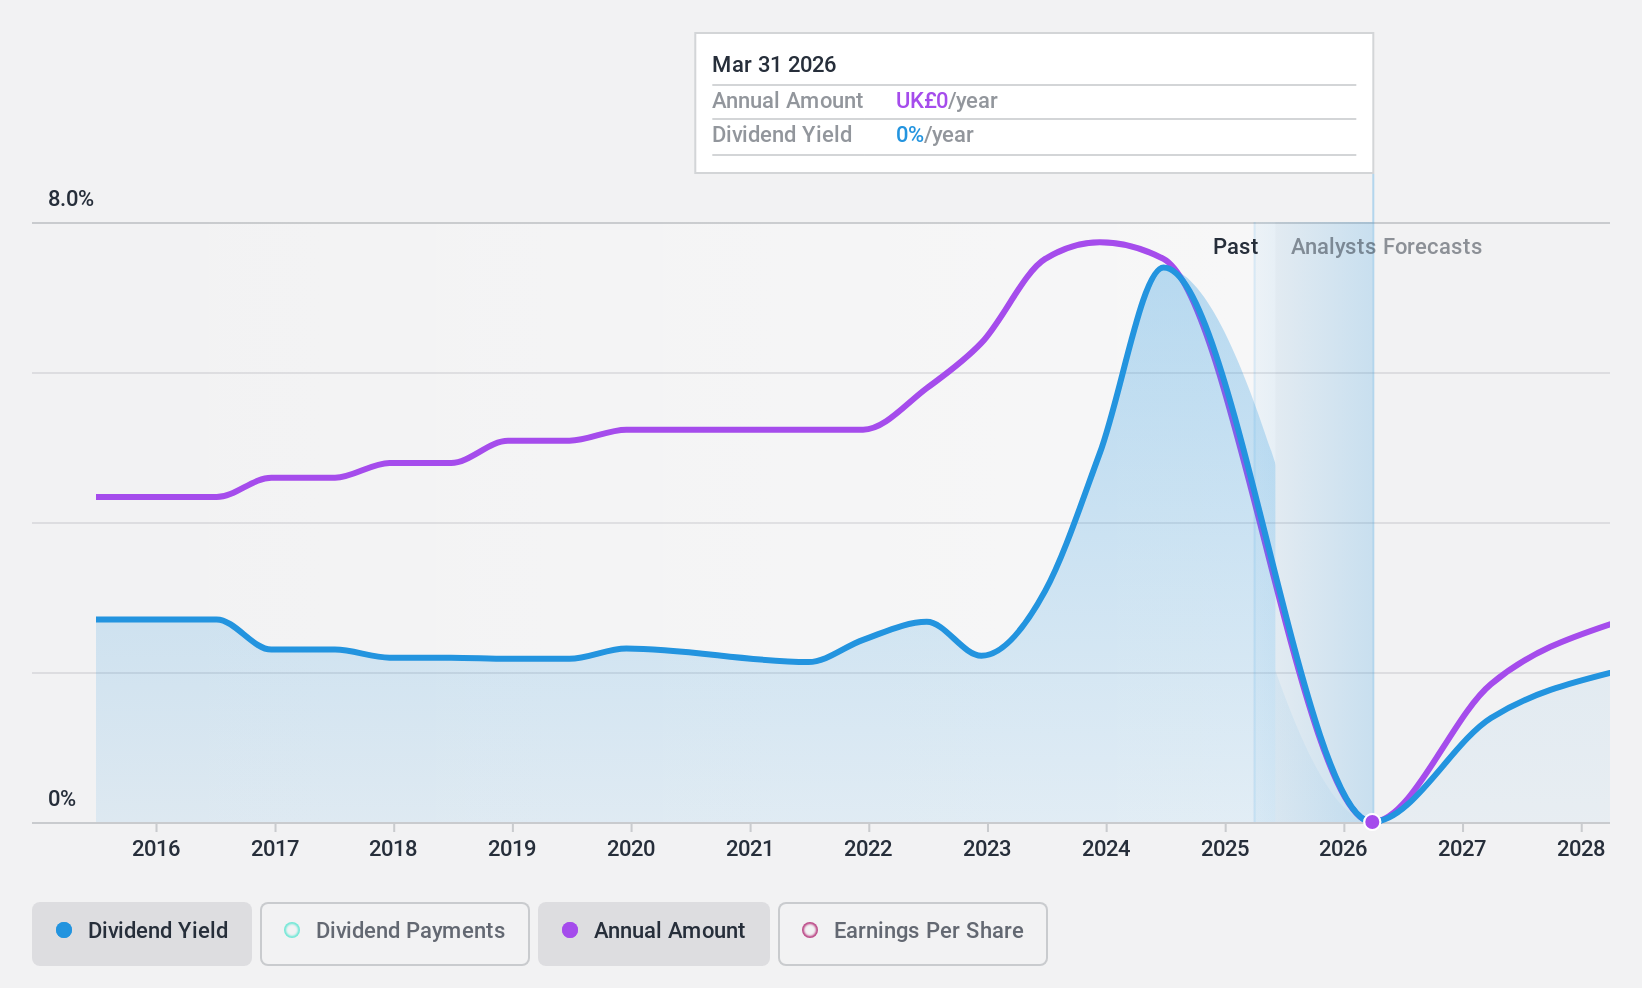
Dividend Yield: 8.5%
Burberry Group's dividend history reveals a pattern of volatility, with significant annual fluctuations over the past decade. Despite this, dividends have shown growth during this period. Currently, the dividend yield stands at 8.48%, placing it in the top quartile of UK dividend payers. The dividends are reasonably secure, backed by both earnings and cash flows with payout ratios of 82.5% and 73% respectively. However, recent leadership changes and a forecasted decline in sales add elements of uncertainty to its financial outlook.
- Delve into the full analysis dividend report here for a deeper understanding of Burberry Group.
- The valuation report we've compiled suggests that Burberry Group's current price could be quite moderate.
Man Group (LSE:EMG)
Simply Wall St Dividend Rating: ★★★★☆☆
Overview: Man Group Limited is a publicly owned investment manager with a market capitalization of approximately £2.97 billion.
Operations: Man Group Limited generates its revenue primarily through its investment management business, which reported earnings of $1.17 billion.
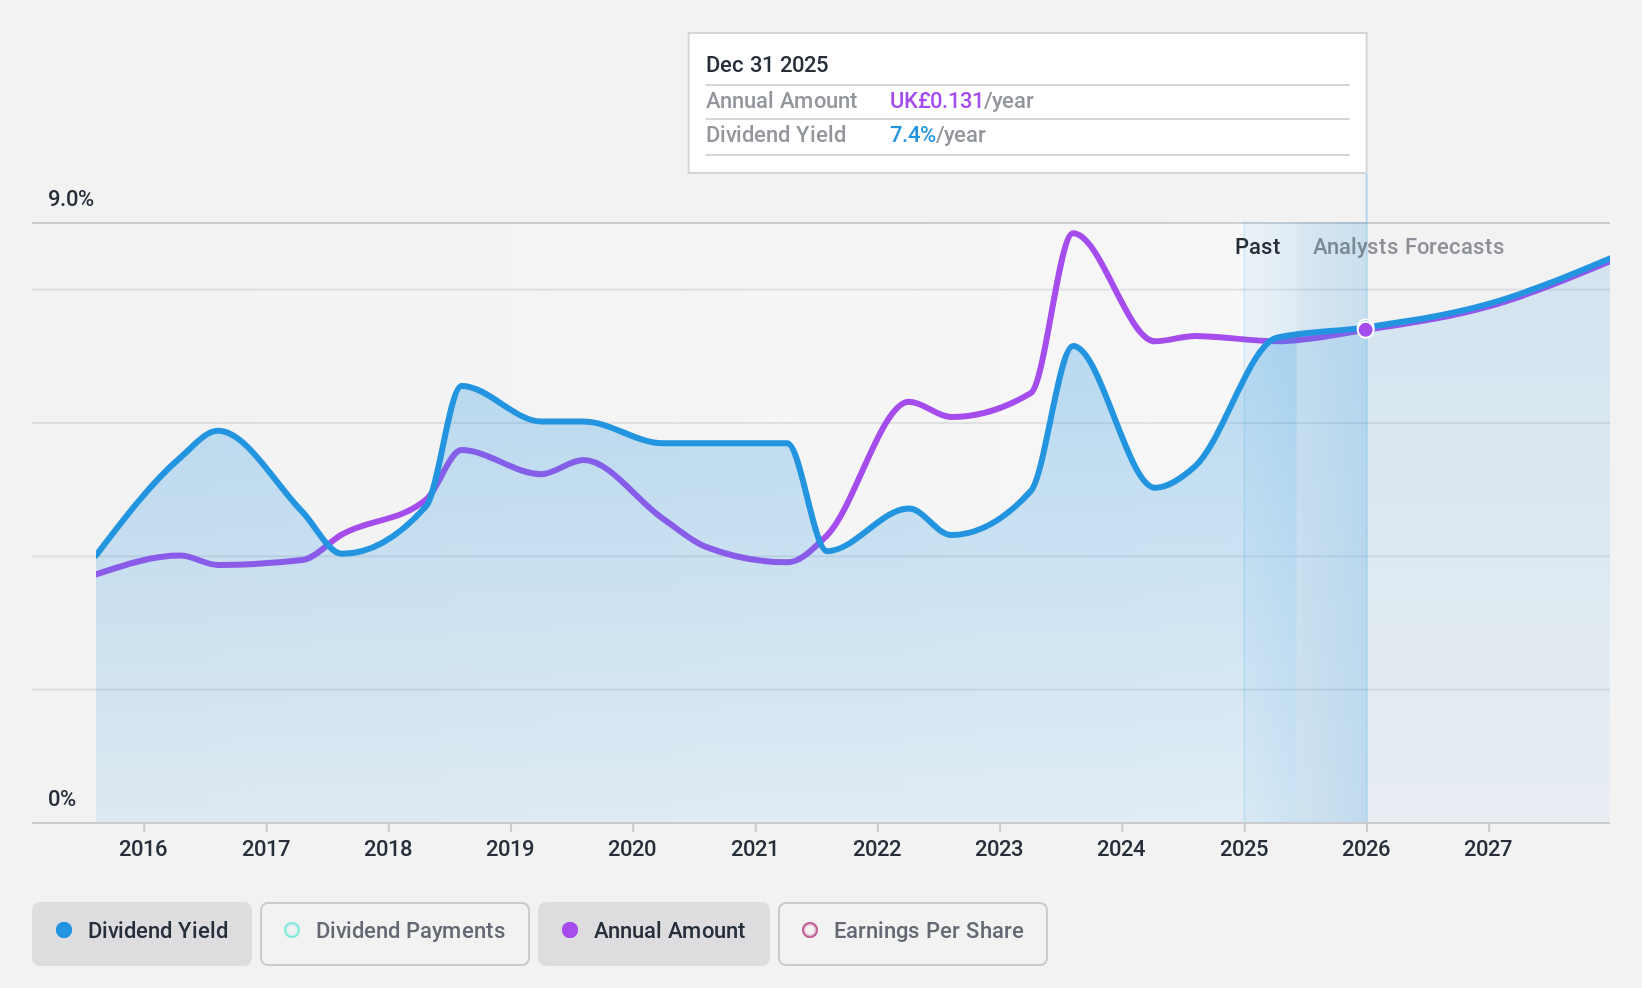
Dividend Yield: 4.9%
Man Group's dividend history has been marked by inconsistency, with significant drops over the past decade. Currently, dividends are supported by a payout ratio of 82% and a cash payout ratio of 61.8%, indicating coverage by both earnings and cash flows. However, the firm's dividend yield of 4.91% is below the top quartile average in the UK market (5.47%). Recent executive appointments could influence future financial strategies but have yet to stabilize its dividend payments fully.
- Click here and access our complete dividend analysis report to understand the dynamics of Man Group.
- Upon reviewing our latest valuation report, Man Group's share price might be too pessimistic.
Where To Now?
- Reveal the 55 hidden gems among our Top UK Dividend Stocks screener with a single click here.
- Invested in any of these stocks? Simplify your portfolio management with Simply Wall St and stay ahead with our alerts for any critical updates on your stocks.
- Invest smarter with the free Simply Wall St app providing detailed insights into every stock market around the globe.
Contemplating Other Strategies?
- Explore high-performing small cap companies that haven't yet garnered significant analyst attention.
- Fuel your portfolio with companies showing strong growth potential, backed by optimistic outlooks both from analysts and management.
- Find companies with promising cash flow potential yet trading below their fair value.
This article by Simply Wall St is general in nature. We provide commentary based on historical data and analyst forecasts only using an unbiased methodology and our articles are not intended to be financial advice. It does not constitute a recommendation to buy or sell any stock, and does not take account of your objectives, or your financial situation. We aim to bring you long-term focused analysis driven by fundamental data. Note that our analysis may not factor in the latest price-sensitive company announcements or qualitative material. Simply Wall St has no position in any stocks mentioned.
If you're looking to trade Burberry Group, open an account with the lowest-cost platform trusted by professionals, Interactive Brokers.
With clients in over 200 countries and territories, and access to 160 markets, IBKR lets you trade stocks, options, futures, forex, bonds and funds from a single integrated account.
Enjoy no hidden fees, no account minimums, and FX conversion rates as low as 0.03%, far better than what most brokers offer.
Sponsored ContentValuation is complex, but we're here to simplify it.
Discover if Burberry Group might be undervalued or overvalued with our detailed analysis, featuring fair value estimates, potential risks, dividends, insider trades, and its financial condition.
Access Free AnalysisHave feedback on this article? Concerned about the content? Get in touch with us directly. Alternatively, email editorial-team@simplywallst.com
About LSE:BRBY
Burberry Group
Manufactures, retails, and wholesales luxury goods under the Burberry brand.
Adequate balance sheet with moderate growth potential.
Market Insights

Community Narratives

