
Advertisement
- United Kingdom
- /
- Professional Services
- /
- AIM:RWS
RWS Holdings plc's (LON:RWS) Stock Has Shown Weakness Lately But Financial Prospects Look Decent: Is The Market Wrong?

RWS Holdings (LON:RWS) has had a rough three months with its share price down 6.3%. However, stock prices are usually driven by a company’s financials over the long term, which in this case look pretty respectable. Particularly, we will be paying attention to RWS Holdings' ROE today.
Return on equity or ROE is a key measure used to assess how efficiently a company's management is utilizing the company's capital. Put another way, it reveals the company's success at turning shareholder investments into profits.
See our latest analysis for RWS Holdings
How Do You Calculate Return On Equity?
The formula for return on equity is:
Return on Equity = Net Profit (from continuing operations) ÷ Shareholders' Equity
So, based on the above formula, the ROE for RWS Holdings is:
5.6% = UK£60m ÷ UK£1.1b (Based on the trailing twelve months to March 2023).
The 'return' is the profit over the last twelve months. That means that for every £1 worth of shareholders' equity, the company generated £0.06 in profit.
What Is The Relationship Between ROE And Earnings Growth?
Thus far, we have learned that ROE measures how efficiently a company is generating its profits. Based on how much of its profits the company chooses to reinvest or "retain", we are then able to evaluate a company's future ability to generate profits. Assuming all else is equal, companies that have both a higher return on equity and higher profit retention are usually the ones that have a higher growth rate when compared to companies that don't have the same features.
RWS Holdings' Earnings Growth And 5.6% ROE
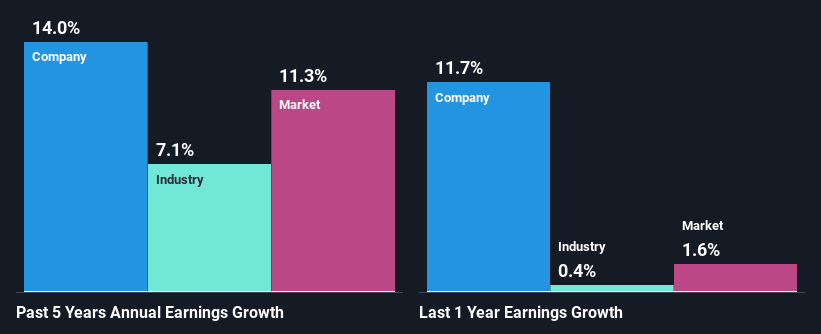
When you first look at it, RWS Holdings' ROE doesn't look that attractive. We then compared the company's ROE to the broader industry and were disappointed to see that the ROE is lower than the industry average of 14%. RWS Holdings was still able to see a decent net income growth of 14% over the past five years. We reckon that there could be other factors at play here. For example, it is possible that the company's management has made some good strategic decisions, or that the company has a low payout ratio.
Next, on comparing with the industry net income growth, we found that RWS Holdings' growth is quite high when compared to the industry average growth of 7.1% in the same period, which is great to see.
Earnings growth is a huge factor in stock valuation. It’s important for an investor to know whether the market has priced in the company's expected earnings growth (or decline). Doing so will help them establish if the stock's future looks promising or ominous. If you're wondering about RWS Holdings''s valuation, check out this gauge of its price-to-earnings ratio, as compared to its industry.
Is RWS Holdings Using Its Retained Earnings Effectively?
RWS Holdings has a significant three-year median payout ratio of 75%, meaning that it is left with only 25% to reinvest into its business. This implies that the company has been able to achieve decent earnings growth despite returning most of its profits to shareholders.
Additionally, RWS Holdings has paid dividends over a period of at least ten years which means that the company is pretty serious about sharing its profits with shareholders. Our latest analyst data shows that the future payout ratio of the company is expected to drop to 49% over the next three years. Accordingly, the expected drop in the payout ratio explains the expected increase in the company's ROE to 10%, over the same period.
Conclusion
In total, it does look like RWS Holdings has some positive aspects to its business. While no doubt its earnings growth is pretty substantial, we do feel that the reinvestment rate is pretty low, meaning, the earnings growth number could have been significantly higher had the company been retaining more of its profits. Having said that, the company's earnings growth is expected to slow down, as forecasted in the current analyst estimates. Are these analysts expectations based on the broad expectations for the industry, or on the company's fundamentals? Click here to be taken to our analyst's forecasts page for the company.
New: AI Stock Screener & Alerts
Our new AI Stock Screener scans the market every day to uncover opportunities.
• Dividend Powerhouses (3%+ Yield)
• Undervalued Small Caps with Insider Buying
• High growth Tech and AI Companies
Or build your own from over 50 metrics.
Have feedback on this article? Concerned about the content? Get in touch with us directly. Alternatively, email editorial-team (at) simplywallst.com.
This article by Simply Wall St is general in nature. We provide commentary based on historical data and analyst forecasts only using an unbiased methodology and our articles are not intended to be financial advice. It does not constitute a recommendation to buy or sell any stock, and does not take account of your objectives, or your financial situation. We aim to bring you long-term focused analysis driven by fundamental data. Note that our analysis may not factor in the latest price-sensitive company announcements or qualitative material. Simply Wall St has no position in any stocks mentioned.
About AIM:RWS
RWS Holdings
Provides technology-enabled language, content, and intellectual property (IP) services in the United Kingdom, Continental Europe, the United States, and internationally.
Flawless balance sheet, undervalued and pays a dividend.
Similar Companies
Market Insights


Advertisement
Community Narratives
The Future of Drug Testing? Fingerprint Tech Shows Serious Promise
Fair Value US$2.98|40.3% undervalued
JO
Community Contributor
Suncorp’s Next Chapter: Insurance-Only and Ready to Grow
Fair Value AU$22.83|7.6% undervalued
RO
Community Contributor
Thyssenkrupp Nucera Will Achieve Double-Digit Profits by 2030 Boosted by Hydrogen Growth
Fair Value €14.40|30.6% undervalued
CH
Community Contributor
Tesla’s Nvidia Moment – The AI & Robotics Inflection Point
Fair Value US$359.72|12.3% undervalued
BL
Community Contributor