
Advertisement

Some say volatility, rather than debt, is the best way to think about risk as an investor, but Warren Buffett famously said that 'Volatility is far from synonymous with risk.' So it seems the smart money knows that debt - which is usually involved in bankruptcies - is a very important factor, when you assess how risky a company is. As with many other companies Parity Group plc (LON:PTY) makes use of debt. But is this debt a concern to shareholders?
Why Does Debt Bring Risk?
Generally speaking, debt only becomes a real problem when a company can't easily pay it off, either by raising capital or with its own cash flow. If things get really bad, the lenders can take control of the business. However, a more usual (but still expensive) situation is where a company must dilute shareholders at a cheap share price simply to get debt under control. Of course, debt can be an important tool in businesses, particularly capital heavy businesses. When we examine debt levels, we first consider both cash and debt levels, together.
View our latest analysis for Parity Group
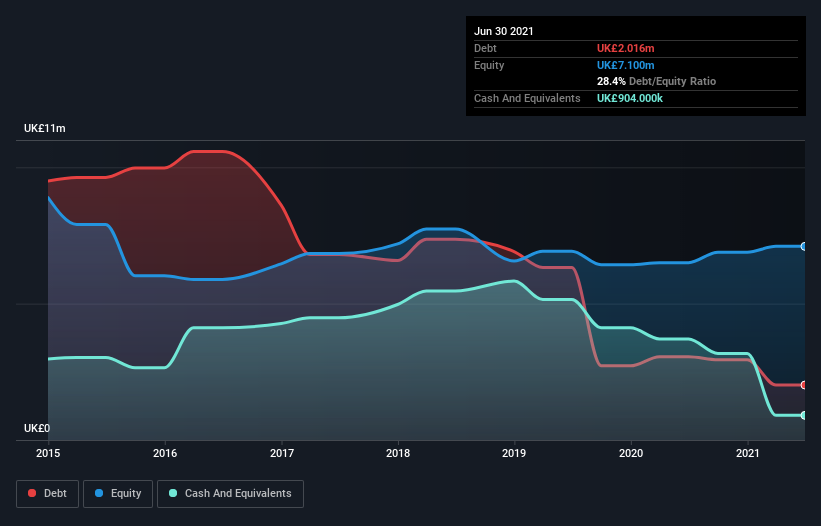
What Is Parity Group's Net Debt?
As you can see below, Parity Group had UK£2.02m of debt at June 2021, down from UK£3.05m a year prior. However, it does have UK£904.0k in cash offsetting this, leading to net debt of about UK£1.11m.
A Look At Parity Group's Liabilities
According to the last reported balance sheet, Parity Group had liabilities of UK£7.85m due within 12 months, and liabilities of UK£120.0k due beyond 12 months. On the other hand, it had cash of UK£904.0k and UK£7.73m worth of receivables due within a year. So it can boast UK£666.0k more liquid assets than total liabilities.
This surplus suggests that Parity Group has a conservative balance sheet, and could probably eliminate its debt without much difficulty.
In order to size up a company's debt relative to its earnings, we calculate its net debt divided by its earnings before interest, tax, depreciation, and amortization (EBITDA) and its earnings before interest and tax (EBIT) divided by its interest expense (its interest cover). Thus we consider debt relative to earnings both with and without depreciation and amortization expenses.
Parity Group shareholders face the double whammy of a high net debt to EBITDA ratio (24.2), and fairly weak interest coverage, since EBIT is just 0.58 times the interest expense. The debt burden here is substantial. Even worse, Parity Group saw its EBIT tank 81% over the last 12 months. If earnings keep going like that over the long term, it has a snowball's chance in hell of paying off that debt. When analysing debt levels, the balance sheet is the obvious place to start. But ultimately the future profitability of the business will decide if Parity Group can strengthen its balance sheet over time. So if you want to see what the professionals think, you might find this free report on analyst profit forecasts to be interesting.
Finally, a business needs free cash flow to pay off debt; accounting profits just don't cut it. So we clearly need to look at whether that EBIT is leading to corresponding free cash flow. Happily for any shareholders, Parity Group actually produced more free cash flow than EBIT over the last three years. That sort of strong cash generation warms our hearts like a puppy in a bumblebee suit.
Our View
Parity Group's EBIT growth rate and interest cover definitely weigh on it, in our esteem. But its conversion of EBIT to free cash flow tells a very different story, and suggests some resilience. We think that Parity Group's debt does make it a bit risky, after considering the aforementioned data points together. That's not necessarily a bad thing, since leverage can boost returns on equity, but it is something to be aware of. The balance sheet is clearly the area to focus on when you are analysing debt. But ultimately, every company can contain risks that exist outside of the balance sheet. We've identified 4 warning signs with Parity Group (at least 2 which are potentially serious) , and understanding them should be part of your investment process.
If, after all that, you're more interested in a fast growing company with a rock-solid balance sheet, then check out our list of net cash growth stocks without delay.
New: Manage All Your Stock Portfolios in One Place
We've created the ultimate portfolio companion for stock investors, and it's free.
• Connect an unlimited number of Portfolios and see your total in one currency
• Be alerted to new Warning Signs or Risks via email or mobile
• Track the Fair Value of your stocks
This article by Simply Wall St is general in nature. We provide commentary based on historical data and analyst forecasts only using an unbiased methodology and our articles are not intended to be financial advice. It does not constitute a recommendation to buy or sell any stock, and does not take account of your objectives, or your financial situation. We aim to bring you long-term focused analysis driven by fundamental data. Note that our analysis may not factor in the latest price-sensitive company announcements or qualitative material. Simply Wall St has no position in any stocks mentioned.
Have feedback on this article? Concerned about the content? Get in touch with us directly. Alternatively, email editorial-team (at) simplywallst.com.
About AIM:PTY
Flawless balance sheet low.
Market Insights

Advertisement
Community Narratives

Apple: A Dying Star with an Overpriced Valuation
Fair Value US$177.34|18.9% overvalued
IN
Community Contributor
Avino a case for USD$20 per share within 5 years (assuming $3,500 gold, $100 silver and $4 copper).
Fair Value CA$26.79|87.5% undervalued
AG
Community Contributor
Riding the Defense Boom RENK Sees Revenue Climb at 15% CAGR by FY 2029
Fair Value €69.87|22.2% undervalued
CH
Community Contributor