

What underlying fundamental trends can indicate that a company might be in decline? When we see a declining return on capital employed (ROCE) in conjunction with a declining base of capital employed, that's often how a mature business shows signs of aging. This reveals that the company isn't compounding shareholder wealth because returns are falling and its net asset base is shrinking. And from a first read, things don't look too good at Parity Group (LON:PTY), so let's see why.
Return On Capital Employed (ROCE): What is it?
If you haven't worked with ROCE before, it measures the 'return' (pre-tax profit) a company generates from capital employed in its business. The formula for this calculation on Parity Group is:
Return on Capital Employed = Earnings Before Interest and Tax (EBIT) ÷ (Total Assets - Current Liabilities)
0.012 = UK£88k ÷ (UK£15m - UK£8.3m) (Based on the trailing twelve months to June 2020).
So, Parity Group has an ROCE of 1.2%. In absolute terms, that's a low return and it also under-performs the Professional Services industry average of 12%.
View our latest analysis for Parity Group
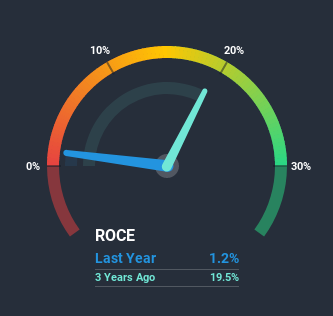
Historical performance is a great place to start when researching a stock so above you can see the gauge for Parity Group's ROCE against it's prior returns. If you'd like to look at how Parity Group has performed in the past in other metrics, you can view this free graph of past earnings, revenue and cash flow.
What Can We Tell From Parity Group's ROCE Trend?
The trend of returns that Parity Group is generating are raising some concerns. Unfortunately, returns have declined substantially over the last five years to the 1.2% we see today. What's equally concerning is that the amount of capital deployed in the business has shrunk by 30% over that same period. The fact that both are shrinking is an indication that the business is going through some tough times. If these underlying trends continue, we wouldn't be too optimistic going forward.
On a related note, Parity Group has decreased its current liabilities to 54% of total assets. That could partly explain why the ROCE has dropped. What's more, this can reduce some aspects of risk to the business because now the company's suppliers or short-term creditors are funding less of its operations. Some would claim this reduces the business' efficiency at generating ROCE since it is now funding more of the operations with its own money. Either way, they're still at a pretty high level, so we'd like to see them fall further if possible.
Our Take On Parity Group's ROCE
In summary, it's unfortunate that Parity Group is shrinking its capital base and also generating lower returns. And, the stock has remained flat over the last five years, so investors don't seem too impressed either. Unless there is a shift to a more positive trajectory in these metrics, we would look elsewhere.
Like most companies, Parity Group does come with some risks, and we've found 2 warning signs that you should be aware of.
While Parity Group may not currently earn the highest returns, we've compiled a list of companies that currently earn more than 25% return on equity. Check out this free list here.
If you decide to trade Parity Group, use the lowest-cost* platform that is rated #1 Overall by Barron’s, Interactive Brokers. Trade stocks, options, futures, forex, bonds and funds on 135 markets, all from a single integrated account. Promoted
New: Manage All Your Stock Portfolios in One Place
We've created the ultimate portfolio companion for stock investors, and it's free.
• Connect an unlimited number of Portfolios and see your total in one currency
• Be alerted to new Warning Signs or Risks via email or mobile
• Track the Fair Value of your stocks
This article by Simply Wall St is general in nature. It does not constitute a recommendation to buy or sell any stock, and does not take account of your objectives, or your financial situation. We aim to bring you long-term focused analysis driven by fundamental data. Note that our analysis may not factor in the latest price-sensitive company announcements or qualitative material. Simply Wall St has no position in any stocks mentioned.
*Interactive Brokers Rated Lowest Cost Broker by StockBrokers.com Annual Online Review 2020
Have feedback on this article? Concerned about the content? Get in touch with us directly. Alternatively, email editorial-team (at) simplywallst.com.
About AIM:PTY
Flawless balance sheet low.
Market Insights

Community Narratives


