- United Kingdom
- /
- Professional Services
- /
- AIM:NBB
Positive Sentiment Still Eludes Norman Broadbent plc (LON:NBB) Following 29% Share Price Slump


To the annoyance of some shareholders, Norman Broadbent plc (LON:NBB) shares are down a considerable 29% in the last month, which continues a horrid run for the company. Still, a bad month hasn't completely ruined the past year with the stock gaining 30%, which is great even in a bull market.
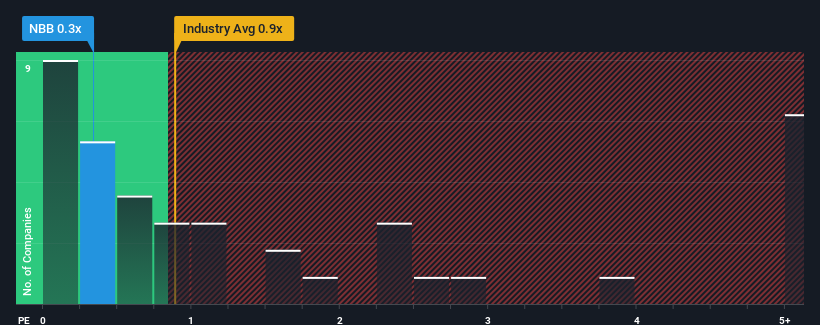
Following the heavy fall in price, Norman Broadbent may be sending bullish signals at the moment with its price-to-sales (or "P/S") ratio of 0.3x, since almost half of all companies in the Professional Services industry in the United Kingdom have P/S ratios greater than 0.9x and even P/S higher than 3x are not unusual. Nonetheless, we'd need to dig a little deeper to determine if there is a rational basis for the reduced P/S.
View our latest analysis for Norman Broadbent
What Does Norman Broadbent's Recent Performance Look Like?
Recent times have been quite advantageous for Norman Broadbent as its revenue has been rising very briskly. One possibility is that the P/S ratio is low because investors think this strong revenue growth might actually underperform the broader industry in the near future. If that doesn't eventuate, then existing shareholders have reason to be quite optimistic about the future direction of the share price.
Although there are no analyst estimates available for Norman Broadbent, take a look at this free data-rich visualisation to see how the company stacks up on earnings, revenue and cash flow.Is There Any Revenue Growth Forecasted For Norman Broadbent?
There's an inherent assumption that a company should underperform the industry for P/S ratios like Norman Broadbent's to be considered reasonable.
Retrospectively, the last year delivered an exceptional 41% gain to the company's top line. Pleasingly, revenue has also lifted 57% in aggregate from three years ago, thanks to the last 12 months of growth. Therefore, it's fair to say the revenue growth recently has been superb for the company.
When compared to the industry's one-year growth forecast of 5.9%, the most recent medium-term revenue trajectory is noticeably more alluring
With this in mind, we find it intriguing that Norman Broadbent's P/S isn't as high compared to that of its industry peers. Apparently some shareholders believe the recent performance has exceeded its limits and have been accepting significantly lower selling prices.
The Bottom Line On Norman Broadbent's P/S
Norman Broadbent's P/S has taken a dip along with its share price. Generally, our preference is to limit the use of the price-to-sales ratio to establishing what the market thinks about the overall health of a company.
We're very surprised to see Norman Broadbent currently trading on a much lower than expected P/S since its recent three-year growth is higher than the wider industry forecast. When we see robust revenue growth that outpaces the industry, we presume that there are notable underlying risks to the company's future performance, which is exerting downward pressure on the P/S ratio. It appears many are indeed anticipating revenue instability, because the persistence of these recent medium-term conditions would normally provide a boost to the share price.
Plus, you should also learn about these 3 warning signs we've spotted with Norman Broadbent (including 1 which can't be ignored).
If companies with solid past earnings growth is up your alley, you may wish to see this free collection of other companies with strong earnings growth and low P/E ratios.
Valuation is complex, but we're here to simplify it.
Discover if Norman Broadbent might be undervalued or overvalued with our detailed analysis, featuring fair value estimates, potential risks, dividends, insider trades, and its financial condition.
Access Free AnalysisHave feedback on this article? Concerned about the content? Get in touch with us directly. Alternatively, email editorial-team (at) simplywallst.com.
This article by Simply Wall St is general in nature. We provide commentary based on historical data and analyst forecasts only using an unbiased methodology and our articles are not intended to be financial advice. It does not constitute a recommendation to buy or sell any stock, and does not take account of your objectives, or your financial situation. We aim to bring you long-term focused analysis driven by fundamental data. Note that our analysis may not factor in the latest price-sensitive company announcements or qualitative material. Simply Wall St has no position in any stocks mentioned.
Have feedback on this article? Concerned about the content? Get in touch with us directly. Alternatively, email editorial-team@simplywallst.com
About AIM:NBB
Norman Broadbent
Provides professional services in the United Kingdom and internationally.
Good value with adequate balance sheet.
Similar Companies
Market Insights

Community Narratives

