- United Kingdom
- /
- Commercial Services
- /
- AIM:FRAN
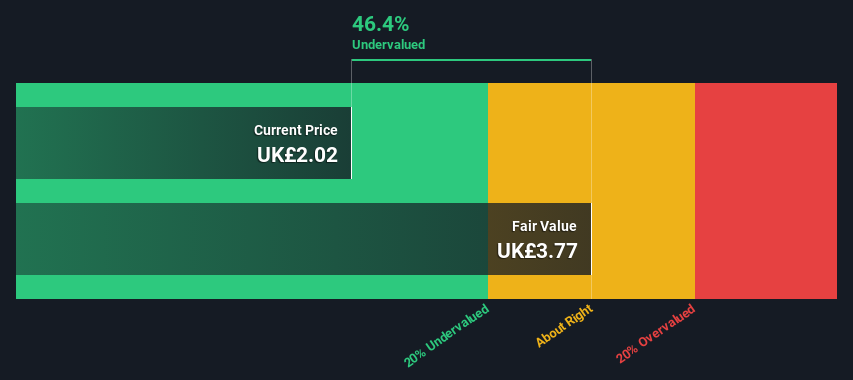
Franchise Brands plc (LON:FRAN) Shares Could Be 46% Below Their Intrinsic Value Estimate


Key Insights
- Franchise Brands' estimated fair value is UK£3.77 based on 2 Stage Free Cash Flow to Equity
- Current share price of UK£2.02 suggests Franchise Brands is potentially 46% undervalued
- The UK£3.23 analyst price target for FRAN is 14% less than our estimate of fair value
How far off is Franchise Brands plc (LON:FRAN) from its intrinsic value? Using the most recent financial data, we'll take a look at whether the stock is fairly priced by taking the forecast future cash flows of the company and discounting them back to today's value. This will be done using the Discounted Cash Flow (DCF) model. It may sound complicated, but actually it is quite simple!
We generally believe that a company's value is the present value of all of the cash it will generate in the future. However, a DCF is just one valuation metric among many, and it is not without flaws. For those who are keen learners of equity analysis, the Simply Wall St analysis model here may be something of interest to you.
Check out our latest analysis for Franchise Brands
The Model
We're using the 2-stage growth model, which simply means we take in account two stages of company's growth. In the initial period the company may have a higher growth rate and the second stage is usually assumed to have a stable growth rate. To start off with, we need to estimate the next ten years of cash flows. Where possible we use analyst estimates, but when these aren't available we extrapolate the previous free cash flow (FCF) from the last estimate or reported value. We assume companies with shrinking free cash flow will slow their rate of shrinkage, and that companies with growing free cash flow will see their growth rate slow, over this period. We do this to reflect that growth tends to slow more in the early years than it does in later years.
A DCF is all about the idea that a dollar in the future is less valuable than a dollar today, and so the sum of these future cash flows is then discounted to today's value:
10-year free cash flow (FCF) forecast
| 2024 | 2025 | 2026 | 2027 | 2028 | 2029 | 2030 | 2031 | 2032 | 2033 | |
| Levered FCF (£, Millions) | UK£18.5m | UK£25.5m | UK£30.9m | UK£35.5m | UK£39.5m | UK£42.8m | UK£45.5m | UK£47.7m | UK£49.5m | UK£51.1m |
| Growth Rate Estimate Source | Analyst x1 | Analyst x1 | Est @ 20.99% | Est @ 15.19% | Est @ 11.12% | Est @ 8.28% | Est @ 6.29% | Est @ 4.89% | Est @ 3.92% | Est @ 3.23% |
| Present Value (£, Millions) Discounted @ 7.2% | UK£17.3 | UK£22.2 | UK£25.1 | UK£26.9 | UK£27.9 | UK£28.2 | UK£28.0 | UK£27.4 | UK£26.5 | UK£25.6 |
("Est" = FCF growth rate estimated by Simply Wall St)
Present Value of 10-year Cash Flow (PVCF) = UK£255m
We now need to calculate the Terminal Value, which accounts for all the future cash flows after this ten year period. For a number of reasons a very conservative growth rate is used that cannot exceed that of a country's GDP growth. In this case we have used the 5-year average of the 10-year government bond yield (1.6%) to estimate future growth. In the same way as with the 10-year 'growth' period, we discount future cash flows to today's value, using a cost of equity of 7.2%.
Terminal Value (TV)= FCF2033 × (1 + g) ÷ (r – g) = UK£51m× (1 + 1.6%) ÷ (7.2%– 1.6%) = UK£938m
Present Value of Terminal Value (PVTV)= TV / (1 + r)10= UK£938m÷ ( 1 + 7.2%)10= UK£469m
The total value, or equity value, is then the sum of the present value of the future cash flows, which in this case is UK£724m. The last step is to then divide the equity value by the number of shares outstanding. Relative to the current share price of UK£2.0, the company appears quite undervalued at a 46% discount to where the stock price trades currently. Valuations are imprecise instruments though, rather like a telescope - move a few degrees and end up in a different galaxy. Do keep this in mind.
Important Assumptions
We would point out that the most important inputs to a discounted cash flow are the discount rate and of course the actual cash flows. You don't have to agree with these inputs, I recommend redoing the calculations yourself and playing with them. The DCF also does not consider the possible cyclicality of an industry, or a company's future capital requirements, so it does not give a full picture of a company's potential performance. Given that we are looking at Franchise Brands as potential shareholders, the cost of equity is used as the discount rate, rather than the cost of capital (or weighted average cost of capital, WACC) which accounts for debt. In this calculation we've used 7.2%, which is based on a levered beta of 1.012. Beta is a measure of a stock's volatility, compared to the market as a whole. We get our beta from the industry average beta of globally comparable companies, with an imposed limit between 0.8 and 2.0, which is a reasonable range for a stable business.
SWOT Analysis for Franchise Brands
- Debt is well covered by earnings.
- Earnings declined over the past year.
- Dividend is low compared to the top 25% of dividend payers in the Commercial Services market.
- Annual revenue is forecast to grow faster than the British market.
- Trading below our estimate of fair value by more than 20%.
- Debt is not well covered by operating cash flow.
- Revenue is forecast to grow slower than 20% per year.
Next Steps:
Although the valuation of a company is important, it ideally won't be the sole piece of analysis you scrutinize for a company. It's not possible to obtain a foolproof valuation with a DCF model. Preferably you'd apply different cases and assumptions and see how they would impact the company's valuation. For instance, if the terminal value growth rate is adjusted slightly, it can dramatically alter the overall result. What is the reason for the share price sitting below the intrinsic value? For Franchise Brands, there are three additional elements you should further research:
- Risks: As an example, we've found 2 warning signs for Franchise Brands that you need to consider before investing here.
- Future Earnings: How does FRAN's growth rate compare to its peers and the wider market? Dig deeper into the analyst consensus number for the upcoming years by interacting with our free analyst growth expectation chart.
- Other Solid Businesses: Low debt, high returns on equity and good past performance are fundamental to a strong business. Why not explore our interactive list of stocks with solid business fundamentals to see if there are other companies you may not have considered!
PS. The Simply Wall St app conducts a discounted cash flow valuation for every stock on the AIM every day. If you want to find the calculation for other stocks just search here.
If you're looking to trade Franchise Brands, open an account with the lowest-cost platform trusted by professionals, Interactive Brokers.
With clients in over 200 countries and territories, and access to 160 markets, IBKR lets you trade stocks, options, futures, forex, bonds and funds from a single integrated account.
Enjoy no hidden fees, no account minimums, and FX conversion rates as low as 0.03%, far better than what most brokers offer.
Sponsored ContentNew: AI Stock Screener & Alerts
Our new AI Stock Screener scans the market every day to uncover opportunities.
• Dividend Powerhouses (3%+ Yield)
• Undervalued Small Caps with Insider Buying
• High growth Tech and AI Companies
Or build your own from over 50 metrics.
Have feedback on this article? Concerned about the content? Get in touch with us directly. Alternatively, email editorial-team (at) simplywallst.com.
This article by Simply Wall St is general in nature. We provide commentary based on historical data and analyst forecasts only using an unbiased methodology and our articles are not intended to be financial advice. It does not constitute a recommendation to buy or sell any stock, and does not take account of your objectives, or your financial situation. We aim to bring you long-term focused analysis driven by fundamental data. Note that our analysis may not factor in the latest price-sensitive company announcements or qualitative material. Simply Wall St has no position in any stocks mentioned.
About AIM:FRAN
Franchise Brands
Through its subsidiaries, engages in franchising and related activities in the United Kingdom, Ireland, North America, and Continental Europe.
Solid track record with reasonable growth potential.
Market Insights

Community Narratives

