Advertisement
- United Kingdom
- /
- Diversified Financial
- /
- LSE:PAY
3 UK Stocks Estimated To Be Trading Below Their Intrinsic Value

Simply Wall St
Reviewed by Simply Wall St
As the United Kingdom's FTSE 100 index faces pressure from weak global cues and faltering trade data from China, investors are keenly observing market movements for opportunities. In such volatile times, identifying stocks that are trading below their intrinsic value can be a prudent strategy, as these may offer potential growth when market conditions stabilize.
Top 10 Undervalued Stocks Based On Cash Flows In The United Kingdom
| Name | Current Price | Fair Value (Est) | Discount (Est) |
| TBC Bank Group (LSE:TBCG) | £44.70 | £89.39 | 50% |
| SigmaRoc (AIM:SRC) | £1.244 | £2.42 | 48.5% |
| PageGroup (LSE:PAGE) | £2.216 | £4.41 | 49.8% |
| LSL Property Services (LSE:LSL) | £2.82 | £5.57 | 49.4% |
| Likewise Group (AIM:LIKE) | £0.27 | £0.52 | 48.1% |
| Hollywood Bowl Group (LSE:BOWL) | £2.525 | £4.85 | 47.9% |
| Gym Group (LSE:GYM) | £1.508 | £2.93 | 48.5% |
| Gooch & Housego (AIM:GHH) | £5.52 | £10.78 | 48.8% |
| Essentra (LSE:ESNT) | £1.01 | £1.96 | 48.5% |
| AstraZeneca (LSE:AZN) | £113.04 | £224.87 | 49.7% |
Here we highlight a subset of our preferred stocks from the screener.
Fintel (AIM:FNTL)
Overview: Fintel Plc provides intermediary services and distribution channels to the retail financial services sector in the United Kingdom, with a market cap of £237.56 million.
Operations: Revenue Segments (in millions of £): null
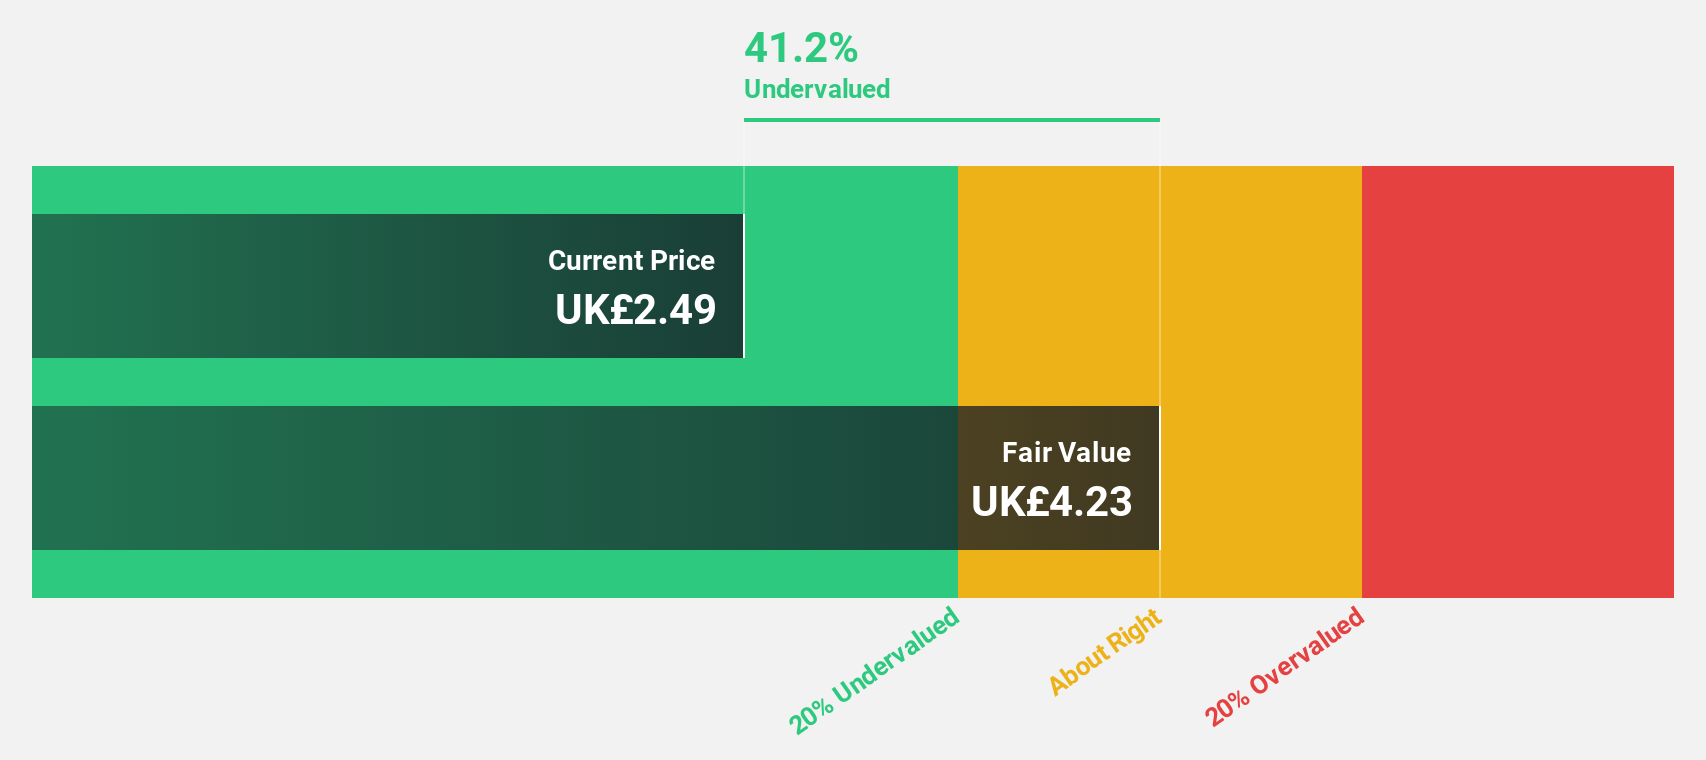
Estimated Discount To Fair Value: 40.3%
Fintel Plc's recent financial performance and forecasts suggest it is undervalued based on cash flows. The company reported H1 2025 sales of £42.4 million, a rise from £35.7 million the previous year, with net income increasing to £2.4 million. Analysts forecast significant earnings growth of over 31% annually, outpacing the UK market average. Trading at approximately 40% below its estimated fair value of £3.82 per share, Fintel appears attractively priced for potential investors focusing on cash flow valuation metrics.
- Our earnings growth report unveils the potential for significant increases in Fintel's future results.
- Click here and access our complete balance sheet health report to understand the dynamics of Fintel.
PayPoint (LSE:PAY)
Overview: PayPoint plc provides payments and banking, shopping, and e-commerce services and products in the United Kingdom with a market cap of £457.34 million.
Operations: The company's revenue is derived from two main segments: Love2shop, contributing £147.14 million, and Pay Point, accounting for £163.58 million.
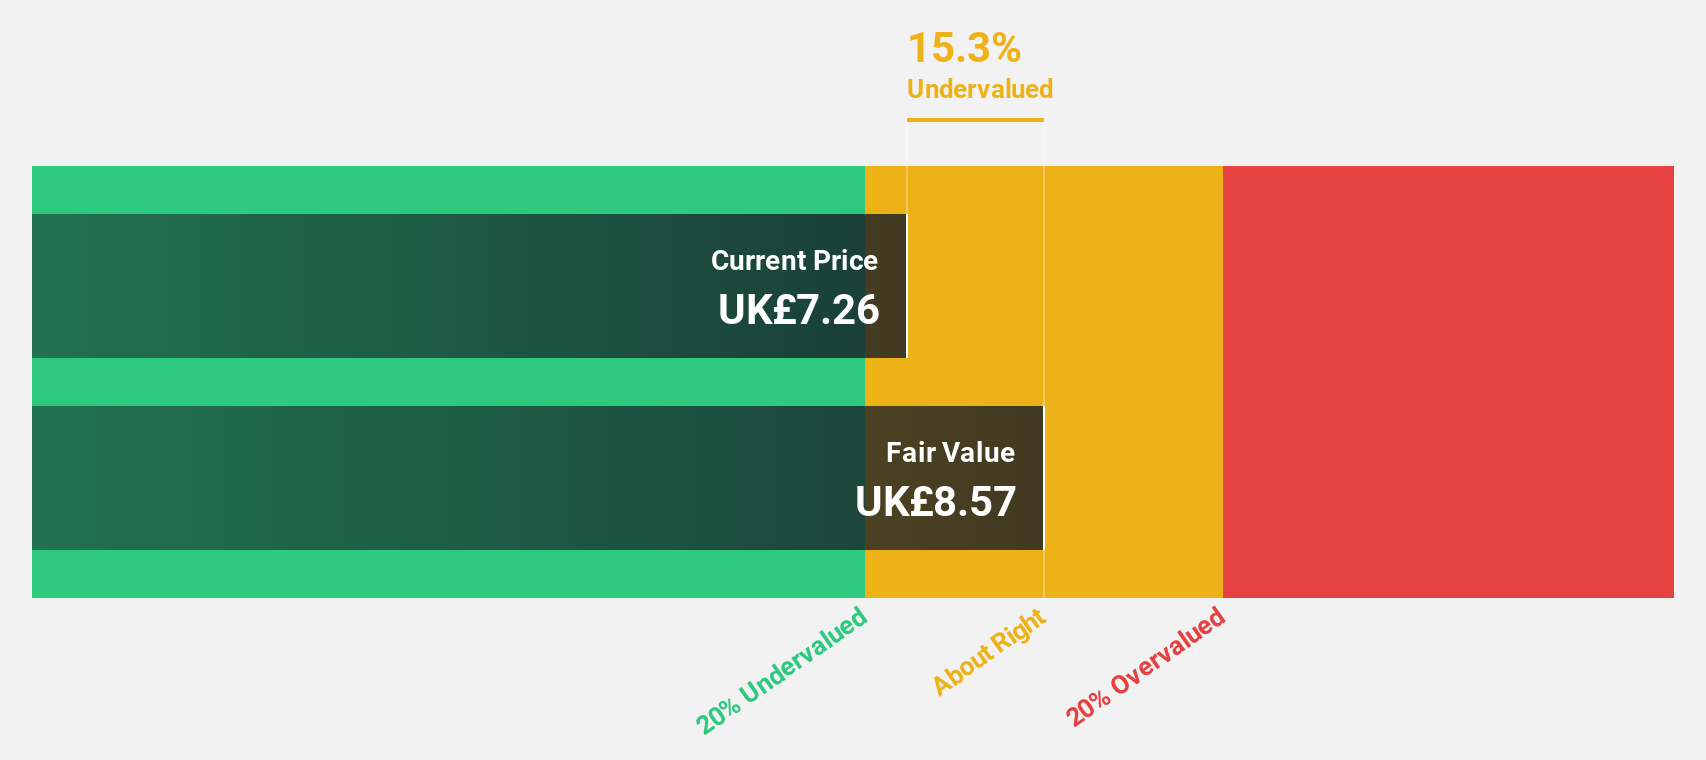
Estimated Discount To Fair Value: 20.9%
PayPoint plc's stock is currently trading over 20% below its estimated fair value of £8.35, making it an attractive option for those focusing on cash flow valuation. Despite a forecasted revenue decline of 12.1% annually over the next three years, earnings are expected to grow significantly at 43.5% per year, outperforming the UK market average. Recent partnerships with Lloyds Banking Group and a £30 million share buyback program further enhance its financial position amidst high debt levels and low profit margins.
- In light of our recent growth report, it seems possible that PayPoint's financial performance will exceed current levels.
- Dive into the specifics of PayPoint here with our thorough financial health report.
Stelrad Group (LSE:SRAD)
Overview: Stelrad Group PLC manufactures and distributes radiators across the United Kingdom, Ireland, Europe, Turkey, and internationally with a market cap of £204.40 million.
Operations: The company's revenue segment primarily consists of the manufacture and distribution of radiators, generating £283.94 million.
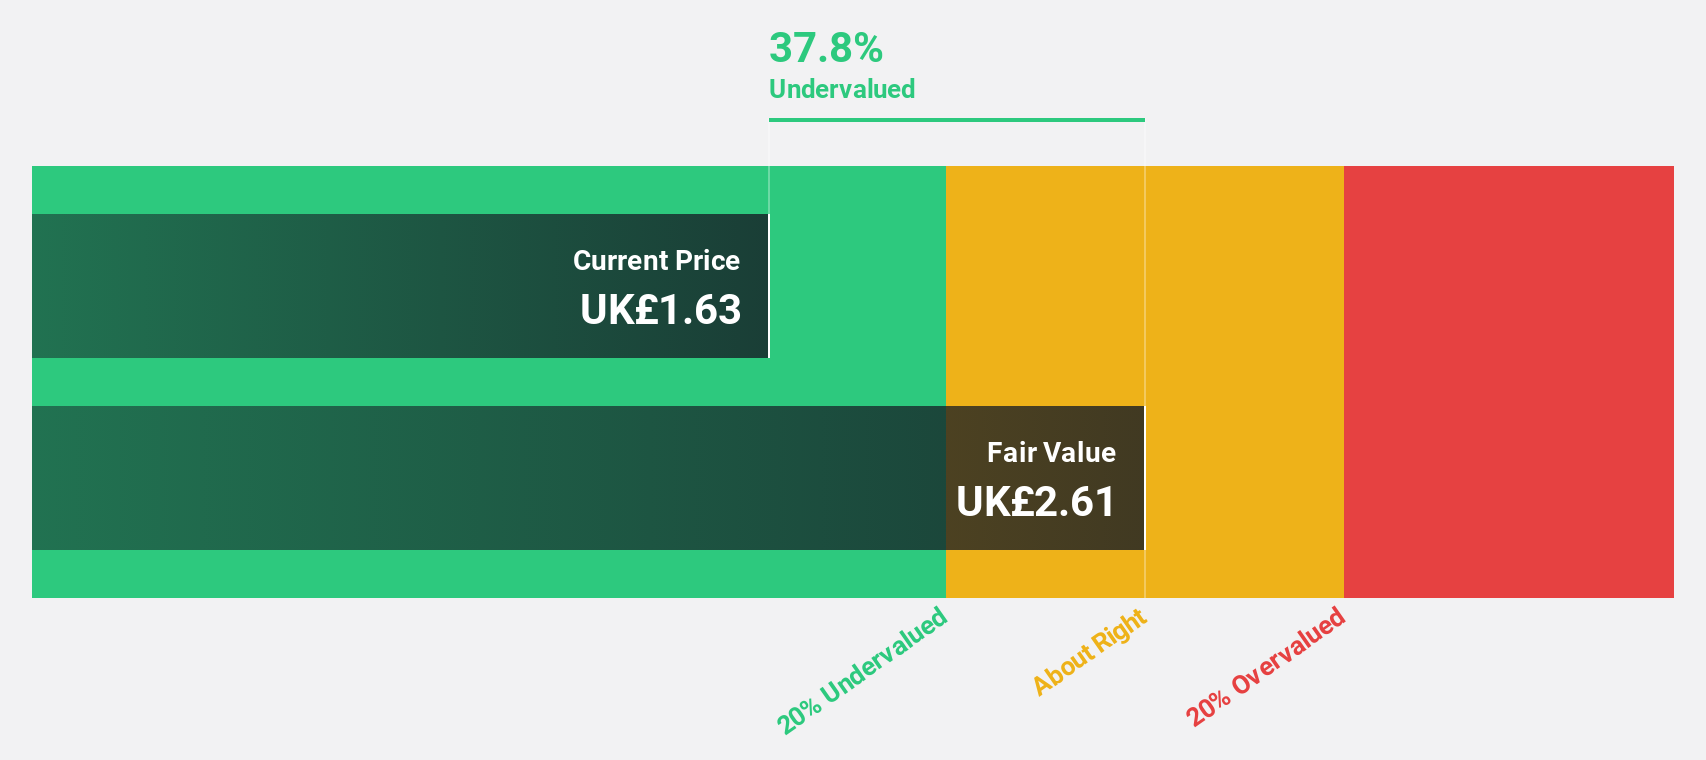
Estimated Discount To Fair Value: 38.2%
Stelrad Group is trading 38.2% below its estimated fair value of £2.6, presenting potential for investors focused on cash flow valuation. Despite a high debt level and declining profit margins, earnings are forecast to grow significantly at 37.5% annually, outpacing the UK market average. Recent earnings reports show a net loss of £3.45 million for H1 2025, but analysts agree on a potential stock price increase of 25.9%, supported by an interim dividend rise to 3.04 pence per share.
- Our expertly prepared growth report on Stelrad Group implies its future financial outlook may be stronger than recent results.
- Click here to discover the nuances of Stelrad Group with our detailed financial health report.
Seize The Opportunity
- Discover the full array of 57 Undervalued UK Stocks Based On Cash Flows right here.
- Shareholder in one or more of these companies? Ensure you're never caught off-guard by adding your portfolio in Simply Wall St for timely alerts on significant stock developments.
- Maximize your investment potential with Simply Wall St, the comprehensive app that offers global market insights for free.
Ready For A Different Approach?
- Explore high-performing small cap companies that haven't yet garnered significant analyst attention.
- Diversify your portfolio with solid dividend payers offering reliable income streams to weather potential market turbulence.
- Fuel your portfolio with companies showing strong growth potential, backed by optimistic outlooks both from analysts and management.
This article by Simply Wall St is general in nature. We provide commentary based on historical data and analyst forecasts only using an unbiased methodology and our articles are not intended to be financial advice. It does not constitute a recommendation to buy or sell any stock, and does not take account of your objectives, or your financial situation. We aim to bring you long-term focused analysis driven by fundamental data. Note that our analysis may not factor in the latest price-sensitive company announcements or qualitative material. Simply Wall St has no position in any stocks mentioned.
New: Manage All Your Stock Portfolios in One Place
We've created the ultimate portfolio companion for stock investors, and it's free.
• Connect an unlimited number of Portfolios and see your total in one currency
• Be alerted to new Warning Signs or Risks via email or mobile
• Track the Fair Value of your stocks
Have feedback on this article? Concerned about the content? Get in touch with us directly. Alternatively, email editorial-team@simplywallst.com
About LSE:PAY
PayPoint
Engages in the provision of payments and banking, shopping, and e-commerce services and products in the United Kingdom.
Reasonable growth potential with adequate balance sheet.
Market Insights

Advertisement
Community Narratives
The company that turned a verb into a global necessity and basically runs the modern internet, digital ads, smartphones, maps, and AI.
Fair Value US$300.00|6.2% undervalued
OS
Community Contributor
Flowers Foods Pays A Fair Price For Health
Fair Value US$16.12|25.1% undervalued
NV
Community Contributor
TMX Group will thrive with 33.3% profit margin and enduring market moat
Fair Value CA$49.90|0.04% overvalued
LI
Community Contributor