
Advertisement
- United Kingdom
- /
- Industrials
- /
- LSE:SMIN
Smiths Group's (LON:SMIN) 9.7% CAGR outpaced the company's earnings growth over the same three-year period

By buying an index fund, investors can approximate the average market return. But if you choose individual stocks with prowess, you can make superior returns. For example, Smiths Group plc (LON:SMIN) shareholders have seen the share price rise 22% over three years, well in excess of the market return (4.5%, not including dividends). However, more recent returns haven't been as impressive as that, with the stock returning just 14% in the last year, including dividends.
On the back of a solid 7-day performance, let's check what role the company's fundamentals have played in driving long term shareholder returns.
See our latest analysis for Smiths Group
While the efficient markets hypothesis continues to be taught by some, it has been proven that markets are over-reactive dynamic systems, and investors are not always rational. By comparing earnings per share (EPS) and share price changes over time, we can get a feel for how investor attitudes to a company have morphed over time.
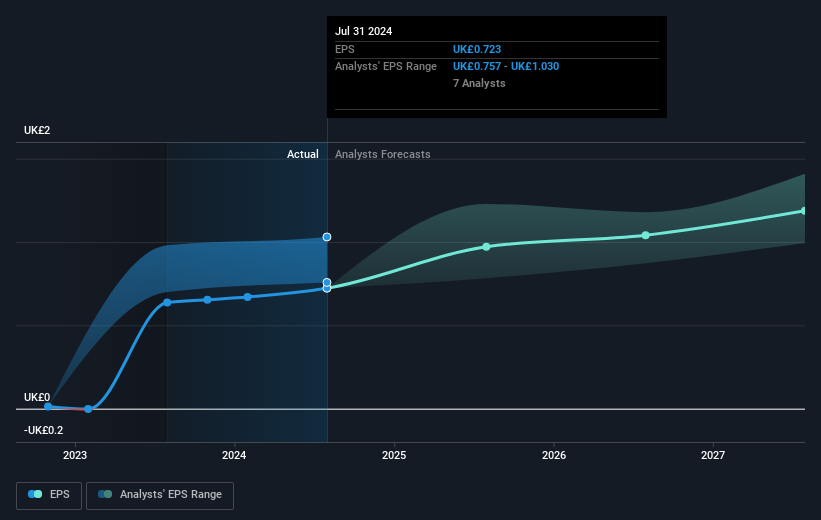
Smiths Group was able to grow its EPS at 23% per year over three years, sending the share price higher. The average annual share price increase of 7% is actually lower than the EPS growth. Therefore, it seems the market has moderated its expectations for growth, somewhat.
You can see below how EPS has changed over time (discover the exact values by clicking on the image).
It's probably worth noting we've seen significant insider buying in the last quarter, which we consider a positive. On the other hand, we think the revenue and earnings trends are much more meaningful measures of the business. Dive deeper into the earnings by checking this interactive graph of Smiths Group's earnings, revenue and cash flow.
What About Dividends?
It is important to consider the total shareholder return, as well as the share price return, for any given stock. The TSR incorporates the value of any spin-offs or discounted capital raisings, along with any dividends, based on the assumption that the dividends are reinvested. So for companies that pay a generous dividend, the TSR is often a lot higher than the share price return. In the case of Smiths Group, it has a TSR of 32% for the last 3 years. That exceeds its share price return that we previously mentioned. And there's no prize for guessing that the dividend payments largely explain the divergence!
A Different Perspective
Smiths Group provided a TSR of 14% over the year (including dividends). That's fairly close to the broader market return. That gain looks pretty satisfying, and it is even better than the five-year TSR of 4% per year. It is possible that management foresight will bring growth well into the future, even if the share price slows down. I find it very interesting to look at share price over the long term as a proxy for business performance. But to truly gain insight, we need to consider other information, too. For example, we've discovered 1 warning sign for Smiths Group that you should be aware of before investing here.
Smiths Group is not the only stock insiders are buying. So take a peek at this free list of small cap companies at attractive valuations which insiders have been buying.
Please note, the market returns quoted in this article reflect the market weighted average returns of stocks that currently trade on British exchanges.
New: Manage All Your Stock Portfolios in One Place
We've created the ultimate portfolio companion for stock investors, and it's free.
• Connect an unlimited number of Portfolios and see your total in one currency
• Be alerted to new Warning Signs or Risks via email or mobile
• Track the Fair Value of your stocks
Have feedback on this article? Concerned about the content? Get in touch with us directly. Alternatively, email editorial-team (at) simplywallst.com.
This article by Simply Wall St is general in nature. We provide commentary based on historical data and analyst forecasts only using an unbiased methodology and our articles are not intended to be financial advice. It does not constitute a recommendation to buy or sell any stock, and does not take account of your objectives, or your financial situation. We aim to bring you long-term focused analysis driven by fundamental data. Note that our analysis may not factor in the latest price-sensitive company announcements or qualitative material. Simply Wall St has no position in any stocks mentioned.
About LSE:SMIN
Smiths Group
Operates as an industrial technology company in Americas, Europe, the Asia Pacific, and internationally.
Flawless balance sheet with solid track record.
Similar Companies
Market Insights

Advertisement
Community Narratives
Pinterest will surge as advertising innovations ignite revenue growth
Fair Value US$42.63|27.1% undervalued
BR
Community Contributor
Brambles' Revenue Set to Climb 14% with Profit Margins Following
Fair Value AU$21.90|5.9% overvalued
RO
Community Contributor
Challenging Future for STG as Organic Sales Decline by 8.8%
Fair Value DKK 116.13|26.8% undervalued
KA
Community Contributor