- United Kingdom
- /
- Oil and Gas
- /
- AIM:NWF
Top UK Dividend Stocks To Consider In February 2025

Reviewed by Simply Wall St

As the United Kingdom's FTSE 100 index grapples with challenges stemming from weak trade data from China, investors are closely monitoring how these global economic shifts impact domestic markets. In such uncertain times, dividend stocks can offer a degree of stability and income potential, making them an attractive consideration for those looking to navigate the current market volatility.
Top 10 Dividend Stocks In The United Kingdom
| Name | Dividend Yield | Dividend Rating |
| Keller Group (LSE:KLR) | 3.49% | ★★★★★☆ |
| Dunelm Group (LSE:DNLM) | 8.08% | ★★★★★☆ |
| OSB Group (LSE:OSB) | 7.68% | ★★★★★☆ |
| Man Group (LSE:EMG) | 5.95% | ★★★★★☆ |
| DCC (LSE:DCC) | 3.77% | ★★★★★☆ |
| Big Yellow Group (LSE:BYG) | 4.76% | ★★★★★☆ |
| NWF Group (AIM:NWF) | 4.94% | ★★★★★☆ |
| James Latham (AIM:LTHM) | 7.08% | ★★★★★☆ |
| Grafton Group (LSE:GFTU) | 3.94% | ★★★★★☆ |
| RS Group (LSE:RS1) | 3.48% | ★★★★★☆ |
Click here to see the full list of 60 stocks from our Top UK Dividend Stocks screener.
Let's explore several standout options from the results in the screener.
NWF Group (AIM:NWF)
Simply Wall St Dividend Rating: ★★★★★☆
Overview: NWF Group plc, with a market cap of £81.10 million, primarily operates in the United Kingdom through the sale and distribution of fuel oils.
Operations: NWF Group plc generates revenue through its three main segments: Food (£82.30 million), Feeds (£204.10 million), and Fuels (£653.10 million).
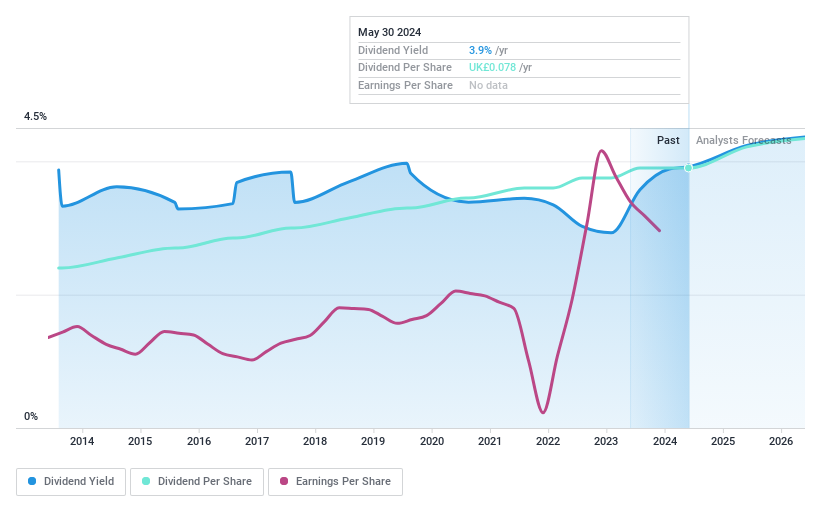
Dividend Yield: 4.9%
NWF Group offers a stable and reliable dividend, maintaining consistent payments over the past decade. Despite recent earnings declines—sales at £454.3 million and net income at £1.6 million—the interim dividend remains unchanged at 1.0 pence per share, reflecting a sustainable payout ratio of 50.1% from earnings and 32.3% from cash flows. Although its yield of 4.94% is below the UK top quartile, it trades attractively below estimated fair value by 40.5%.
- Delve into the full analysis dividend report here for a deeper understanding of NWF Group.
- The valuation report we've compiled suggests that NWF Group's current price could be quite moderate.
Man Group (LSE:EMG)
Simply Wall St Dividend Rating: ★★★★★☆
Overview: Man Group Limited is a publicly owned investment manager with a market cap of £2.44 billion.
Operations: Man Group Limited generates revenue of $1.40 billion from its Investment Management Business segment.
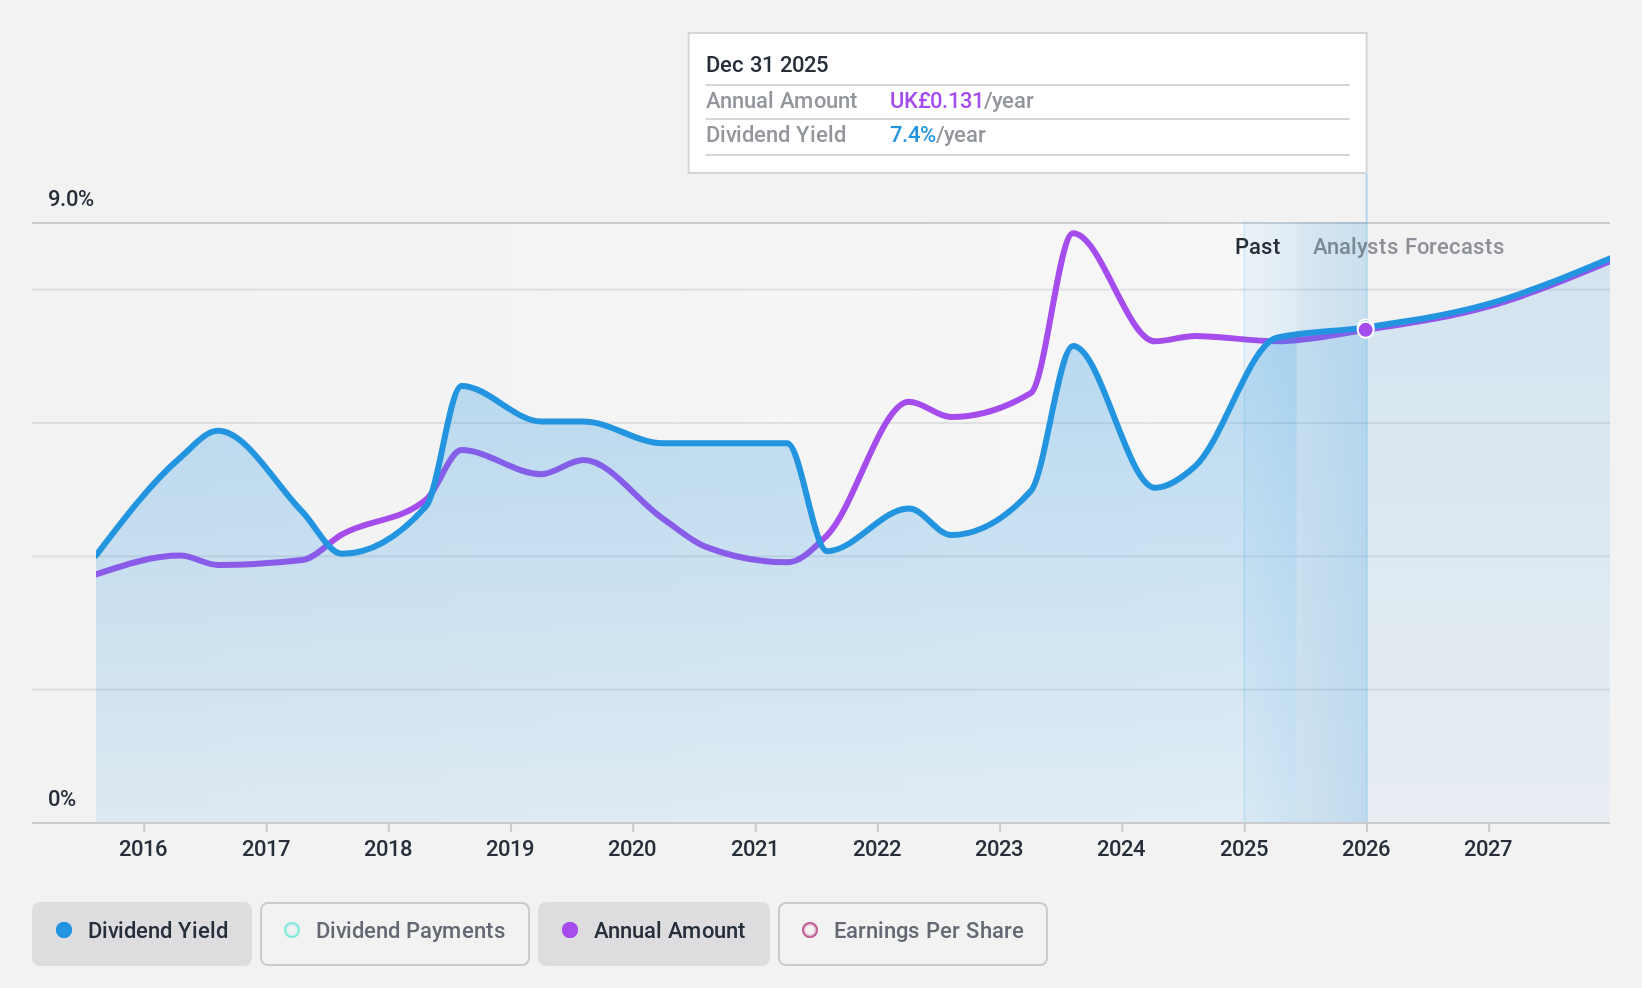
Dividend Yield: 5.9%
Man Group's dividend payments have been volatile over the past decade, yet they remain in the top 25% of UK dividend payers. The company's dividends are well-covered by earnings and cash flows, with a payout ratio of 60.3% and a cash payout ratio of 46.1%. Trading at 61% below its fair value estimate, Man Group presents good relative value compared to peers. Earnings are projected to grow annually by 12.99%, supporting potential future stability in dividends.
- Click to explore a detailed breakdown of our findings in Man Group's dividend report.
- According our valuation report, there's an indication that Man Group's share price might be on the cheaper side.
Morgan Sindall Group (LSE:MGNS)
Simply Wall St Dividend Rating: ★★★★☆☆
Overview: Morgan Sindall Group plc is a UK-based construction and regeneration company with a market cap of £1.75 billion.
Operations: Morgan Sindall Group plc generates revenue through various segments, including Fit Out (£1.24 billion), Construction (£1.02 billion), Infrastructure (£989.20 million), Property Services (£191.80 million), Urban Regeneration (£148.40 million), and Partnership Housing (£845.20 million).
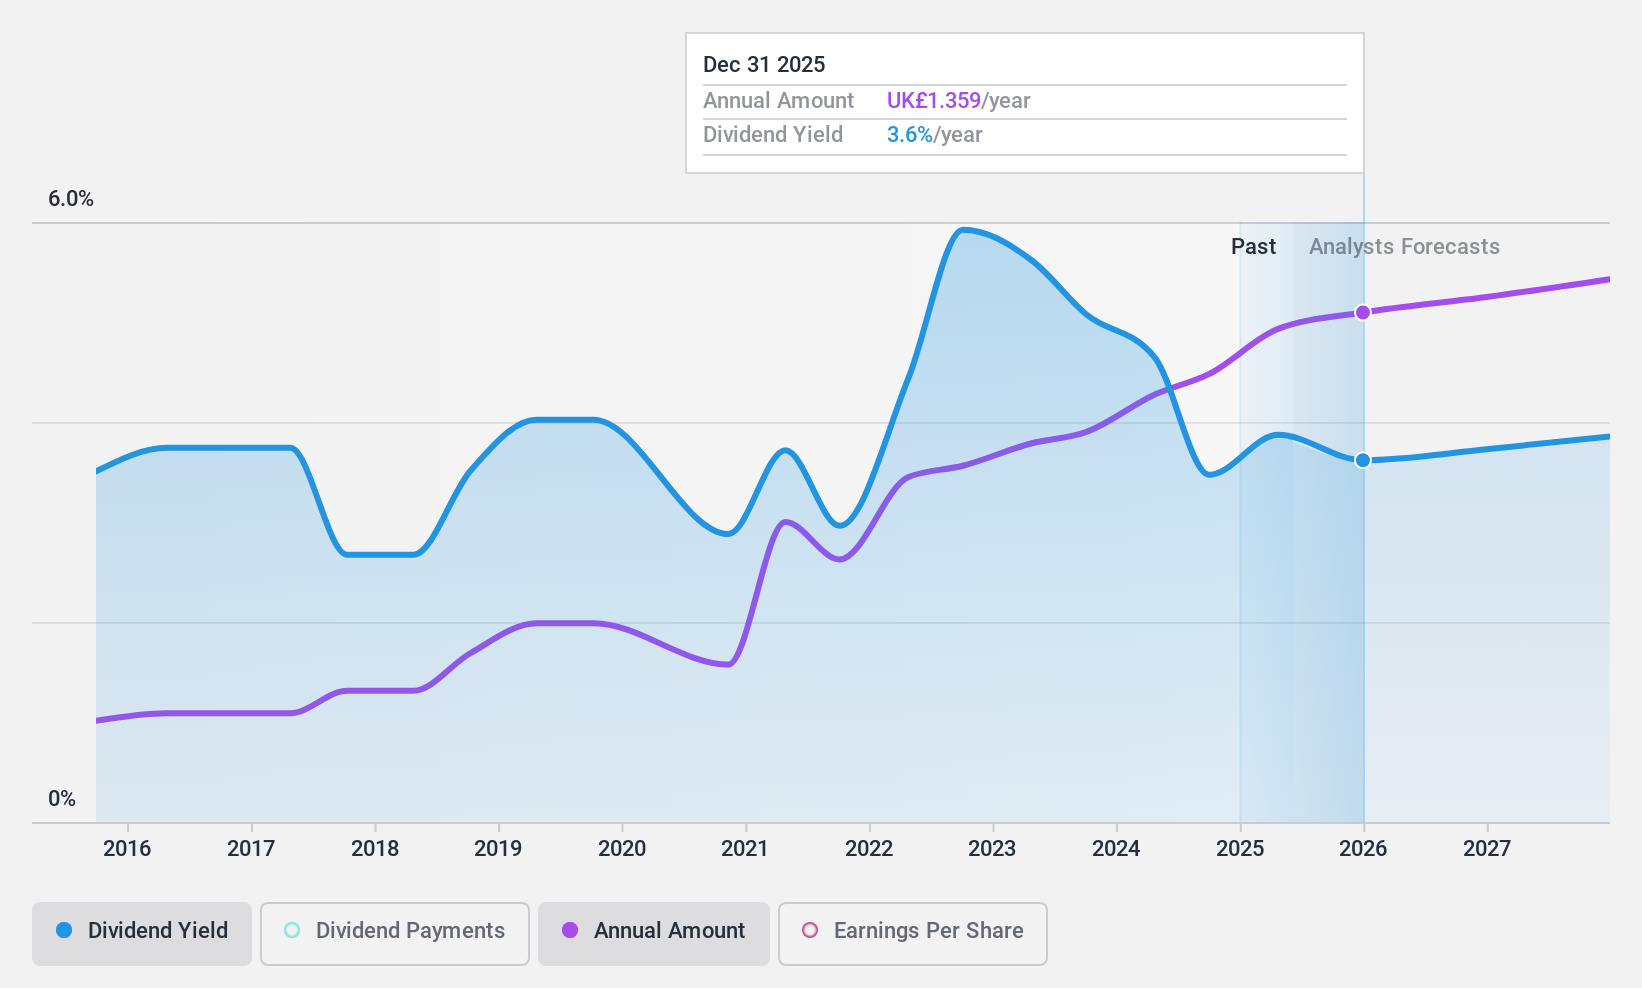
Dividend Yield: 3.2%
Morgan Sindall Group's dividends are well-supported by earnings and cash flows, with a payout ratio of 44.7% and a cash payout ratio of 33.4%. Despite past volatility in dividend payments, they have grown over the last decade. The stock trades at 13.8% below its estimated fair value, indicating potential value for investors. Recent board changes include Peter Harrison's appointment as Chair designate, bringing extensive experience from roles at Schroders and Deutsche Asset Management.
- Get an in-depth perspective on Morgan Sindall Group's performance by reading our dividend report here.
- Our comprehensive valuation report raises the possibility that Morgan Sindall Group is priced higher than what may be justified by its financials.
Taking Advantage
- Click this link to deep-dive into the 60 companies within our Top UK Dividend Stocks screener.
- Have a stake in these businesses? Integrate your holdings into Simply Wall St's portfolio for notifications and detailed stock reports.
- Unlock the power of informed investing with Simply Wall St, your free guide to navigating stock markets worldwide.
Contemplating Other Strategies?
- Explore high-performing small cap companies that haven't yet garnered significant analyst attention.
- Fuel your portfolio with companies showing strong growth potential, backed by optimistic outlooks both from analysts and management.
- Find companies with promising cash flow potential yet trading below their fair value.
This article by Simply Wall St is general in nature. We provide commentary based on historical data and analyst forecasts only using an unbiased methodology and our articles are not intended to be financial advice. It does not constitute a recommendation to buy or sell any stock, and does not take account of your objectives, or your financial situation. We aim to bring you long-term focused analysis driven by fundamental data. Note that our analysis may not factor in the latest price-sensitive company announcements or qualitative material. Simply Wall St has no position in any stocks mentioned.
Valuation is complex, but we're here to simplify it.
Discover if NWF Group might be undervalued or overvalued with our detailed analysis, featuring fair value estimates, potential risks, dividends, insider trades, and its financial condition.
Access Free AnalysisHave feedback on this article? Concerned about the content? Get in touch with us directly. Alternatively, email editorial-team@simplywallst.com
About AIM:NWF
NWF Group
Primarily engages in the sale and distribution of fuel oils in the United Kingdom.
Flawless balance sheet established dividend payer.
Market Insights

Community Narratives


