

Howard Marks put it nicely when he said that, rather than worrying about share price volatility, 'The possibility of permanent loss is the risk I worry about... and every practical investor I know worries about.' So it might be obvious that you need to consider debt, when you think about how risky any given stock is, because too much debt can sink a company. As with many other companies IMI plc (LON:IMI) makes use of debt. But is this debt a concern to shareholders?
When Is Debt Dangerous?
Debt is a tool to help businesses grow, but if a business is incapable of paying off its lenders, then it exists at their mercy. In the worst case scenario, a company can go bankrupt if it cannot pay its creditors. However, a more frequent (but still costly) occurrence is where a company must issue shares at bargain-basement prices, permanently diluting shareholders, just to shore up its balance sheet. By replacing dilution, though, debt can be an extremely good tool for businesses that need capital to invest in growth at high rates of return. When we think about a company's use of debt, we first look at cash and debt together.
View our latest analysis for IMI
What Is IMI's Net Debt?
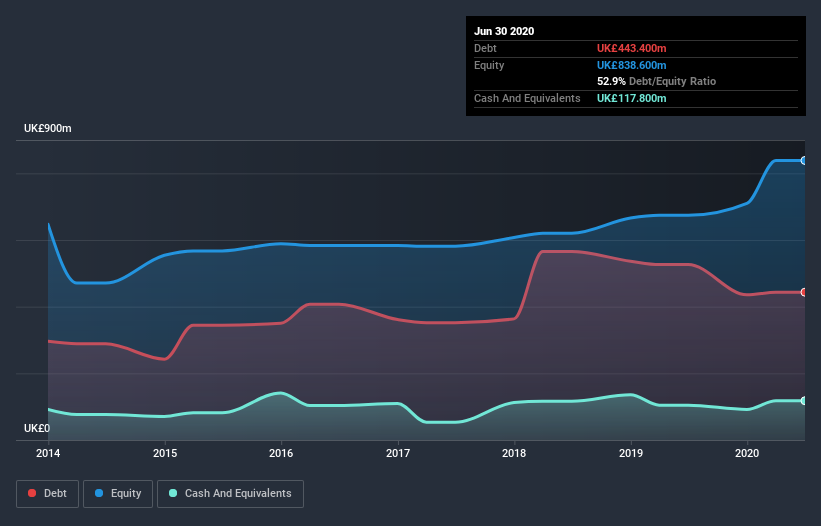
The image below, which you can click on for greater detail, shows that IMI had debt of UK£443.4m at the end of June 2020, a reduction from UK£526.2m over a year. However, because it has a cash reserve of UK£117.8m, its net debt is less, at about UK£325.6m.
How Strong Is IMI's Balance Sheet?
Zooming in on the latest balance sheet data, we can see that IMI had liabilities of UK£575.5m due within 12 months and liabilities of UK£598.4m due beyond that. On the other hand, it had cash of UK£117.8m and UK£408.1m worth of receivables due within a year. So it has liabilities totalling UK£648.0m more than its cash and near-term receivables, combined.
Given IMI has a market capitalization of UK£3.26b, it's hard to believe these liabilities pose much threat. However, we do think it is worth keeping an eye on its balance sheet strength, as it may change over time.
In order to size up a company's debt relative to its earnings, we calculate its net debt divided by its earnings before interest, tax, depreciation, and amortization (EBITDA) and its earnings before interest and tax (EBIT) divided by its interest expense (its interest cover). Thus we consider debt relative to earnings both with and without depreciation and amortization expenses.
IMI's net debt is only 1.0 times its EBITDA. And its EBIT covers its interest expense a whopping 20.6 times over. So you could argue it is no more threatened by its debt than an elephant is by a mouse. While IMI doesn't seem to have gained much on the EBIT line, at least earnings remain stable for now. There's no doubt that we learn most about debt from the balance sheet. But ultimately the future profitability of the business will decide if IMI can strengthen its balance sheet over time. So if you're focused on the future you can check out this free report showing analyst profit forecasts.
But our final consideration is also important, because a company cannot pay debt with paper profits; it needs cold hard cash. So we always check how much of that EBIT is translated into free cash flow. Over the most recent three years, IMI recorded free cash flow worth 74% of its EBIT, which is around normal, given free cash flow excludes interest and tax. This cold hard cash means it can reduce its debt when it wants to.
Our View
The good news is that IMI's demonstrated ability to cover its interest expense with its EBIT delights us like a fluffy puppy does a toddler. And the good news does not stop there, as its conversion of EBIT to free cash flow also supports that impression! Taking all this data into account, it seems to us that IMI takes a pretty sensible approach to debt. While that brings some risk, it can also enhance returns for shareholders. When analysing debt levels, the balance sheet is the obvious place to start. However, not all investment risk resides within the balance sheet - far from it. Case in point: We've spotted 2 warning signs for IMI you should be aware of.
At the end of the day, it's often better to focus on companies that are free from net debt. You can access our special list of such companies (all with a track record of profit growth). It's free.
When trading IMI or any other investment, use the platform considered by many to be the Professional's Gateway to the Worlds Market, Interactive Brokers. You get the lowest-cost* trading on stocks, options, futures, forex, bonds and funds worldwide from a single integrated account. Promoted
New: AI Stock Screener & Alerts
Our new AI Stock Screener scans the market every day to uncover opportunities.
• Dividend Powerhouses (3%+ Yield)
• Undervalued Small Caps with Insider Buying
• High growth Tech and AI Companies
Or build your own from over 50 metrics.
This article by Simply Wall St is general in nature. It does not constitute a recommendation to buy or sell any stock, and does not take account of your objectives, or your financial situation. We aim to bring you long-term focused analysis driven by fundamental data. Note that our analysis may not factor in the latest price-sensitive company announcements or qualitative material. Simply Wall St has no position in any stocks mentioned.
*Interactive Brokers Rated Lowest Cost Broker by StockBrokers.com Annual Online Review 2020
Have feedback on this article? Concerned about the content? Get in touch with us directly. Alternatively, email editorial-team@simplywallst.com.
About LSE:IMI
IMI
An engineering company, designs, manufactures, and services engineering products in the United Kingdom, Germany, rest of Europe, the United States, rest of the Americas, China, rest of the Asia Pacific, the Middle East, and Africa.
Solid track record with excellent balance sheet.
Similar Companies
Market Insights

Community Narratives

