

How far off is Genuit Group plc (LON:GEN) from its intrinsic value? Using the most recent financial data, we'll take a look at whether the stock is fairly priced by taking the expected future cash flows and discounting them to today's value. One way to achieve this is by employing the Discounted Cash Flow (DCF) model. Before you think you won't be able to understand it, just read on! It's actually much less complex than you'd imagine.
Remember though, that there are many ways to estimate a company's value, and a DCF is just one method. For those who are keen learners of equity analysis, the Simply Wall St analysis model here may be something of interest to you.
See our latest analysis for Genuit Group
Step by step through the calculation
We're using the 2-stage growth model, which simply means we take in account two stages of company's growth. In the initial period the company may have a higher growth rate and the second stage is usually assumed to have a stable growth rate. To start off with, we need to estimate the next ten years of cash flows. Where possible we use analyst estimates, but when these aren't available we extrapolate the previous free cash flow (FCF) from the last estimate or reported value. We assume companies with shrinking free cash flow will slow their rate of shrinkage, and that companies with growing free cash flow will see their growth rate slow, over this period. We do this to reflect that growth tends to slow more in the early years than it does in later years.
A DCF is all about the idea that a dollar in the future is less valuable than a dollar today, so we need to discount the sum of these future cash flows to arrive at a present value estimate:
10-year free cash flow (FCF) estimate
| 2022 | 2023 | 2024 | 2025 | 2026 | 2027 | 2028 | 2029 | 2030 | 2031 | |
| Levered FCF (£, Millions) | UK£62.3m | UK£68.5m | UK£69.3m | UK£70.1m | UK£70.8m | UK£71.5m | UK£72.2m | UK£72.8m | UK£73.5m | UK£74.2m |
| Growth Rate Estimate Source | Analyst x4 | Analyst x4 | Est @ 1.17% | Est @ 1.08% | Est @ 1.02% | Est @ 0.98% | Est @ 0.95% | Est @ 0.93% | Est @ 0.91% | Est @ 0.9% |
| Present Value (£, Millions) Discounted @ 6.8% | UK£58.3 | UK£60.0 | UK£56.8 | UK£53.8 | UK£50.8 | UK£48.1 | UK£45.4 | UK£42.9 | UK£40.5 | UK£38.3 |
("Est" = FCF growth rate estimated by Simply Wall St)
Present Value of 10-year Cash Flow (PVCF) = UK£494m
The second stage is also known as Terminal Value, this is the business's cash flow after the first stage. For a number of reasons a very conservative growth rate is used that cannot exceed that of a country's GDP growth. In this case we have used the 5-year average of the 10-year government bond yield (0.9%) to estimate future growth. In the same way as with the 10-year 'growth' period, we discount future cash flows to today's value, using a cost of equity of 6.8%.
Terminal Value (TV)= FCF2031 × (1 + g) ÷ (r – g) = UK£74m× (1 + 0.9%) ÷ (6.8%– 0.9%) = UK£1.3b
Present Value of Terminal Value (PVTV)= TV / (1 + r)10= UK£1.3b÷ ( 1 + 6.8%)10= UK£648m
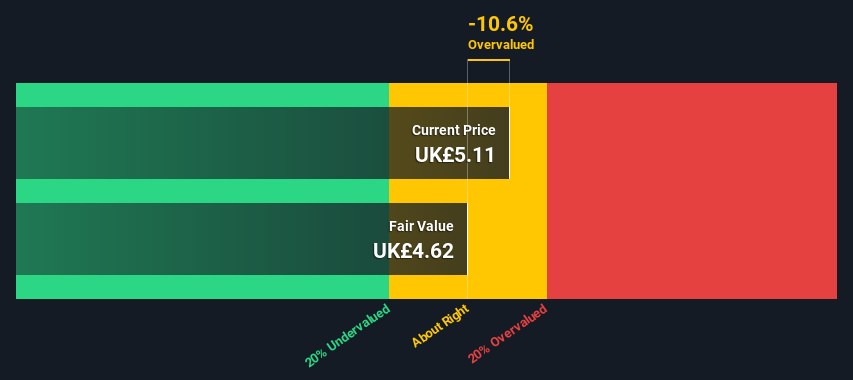
The total value, or equity value, is then the sum of the present value of the future cash flows, which in this case is UK£1.1b. In the final step we divide the equity value by the number of shares outstanding. Relative to the current share price of UK£5.1, the company appears around fair value at the time of writing. Valuations are imprecise instruments though, rather like a telescope - move a few degrees and end up in a different galaxy. Do keep this in mind.
The assumptions
We would point out that the most important inputs to a discounted cash flow are the discount rate and of course the actual cash flows. Part of investing is coming up with your own evaluation of a company's future performance, so try the calculation yourself and check your own assumptions. The DCF also does not consider the possible cyclicality of an industry, or a company's future capital requirements, so it does not give a full picture of a company's potential performance. Given that we are looking at Genuit Group as potential shareholders, the cost of equity is used as the discount rate, rather than the cost of capital (or weighted average cost of capital, WACC) which accounts for debt. In this calculation we've used 6.8%, which is based on a levered beta of 1.232. Beta is a measure of a stock's volatility, compared to the market as a whole. We get our beta from the industry average beta of globally comparable companies, with an imposed limit between 0.8 and 2.0, which is a reasonable range for a stable business.
Moving On:
Although the valuation of a company is important, it ideally won't be the sole piece of analysis you scrutinize for a company. It's not possible to obtain a foolproof valuation with a DCF model. Instead the best use for a DCF model is to test certain assumptions and theories to see if they would lead to the company being undervalued or overvalued. For instance, if the terminal value growth rate is adjusted slightly, it can dramatically alter the overall result. For Genuit Group, we've put together three relevant aspects you should consider:
- Risks: Be aware that Genuit Group is showing 1 warning sign in our investment analysis , you should know about...
- Future Earnings: How does GEN's growth rate compare to its peers and the wider market? Dig deeper into the analyst consensus number for the upcoming years by interacting with our free analyst growth expectation chart.
- Other High Quality Alternatives: Do you like a good all-rounder? Explore our interactive list of high quality stocks to get an idea of what else is out there you may be missing!
PS. The Simply Wall St app conducts a discounted cash flow valuation for every stock on the LSE every day. If you want to find the calculation for other stocks just search here.
New: Manage All Your Stock Portfolios in One Place
We've created the ultimate portfolio companion for stock investors, and it's free.
• Connect an unlimited number of Portfolios and see your total in one currency
• Be alerted to new Warning Signs or Risks via email or mobile
• Track the Fair Value of your stocks
Have feedback on this article? Concerned about the content? Get in touch with us directly. Alternatively, email editorial-team (at) simplywallst.com.
This article by Simply Wall St is general in nature. We provide commentary based on historical data and analyst forecasts only using an unbiased methodology and our articles are not intended to be financial advice. It does not constitute a recommendation to buy or sell any stock, and does not take account of your objectives, or your financial situation. We aim to bring you long-term focused analysis driven by fundamental data. Note that our analysis may not factor in the latest price-sensitive company announcements or qualitative material. Simply Wall St has no position in any stocks mentioned.
About LSE:GEN
Genuit Group
Develops, manufactures, and sells water, climate, and ventilation management solutions in the United Kingdom, rest of the Europe, and internationally.
Excellent balance sheet with reasonable growth potential.
Similar Companies
Market Insights

Community Narratives
