- United Kingdom
- /
- Aerospace & Defense
- /
- LSE:BAB
Babcock International Group (LON:BAB) shareholders are up 5.2% this past week, but still in the red over the last five years


Babcock International Group PLC (LON:BAB) shareholders will doubtless be very grateful to see the share price up 44% in the last month. But over the last half decade, the stock has not performed well. In fact, the share price is down 45%, which falls well short of the return you could get by buying an index fund.
While the stock has risen 5.2% in the past week but long term shareholders are still in the red, let's see what the fundamentals can tell us.
Check out our latest analysis for Babcock International Group
While the efficient markets hypothesis continues to be taught by some, it has been proven that markets are over-reactive dynamic systems, and investors are not always rational. One way to examine how market sentiment has changed over time is to look at the interaction between a company's share price and its earnings per share (EPS).
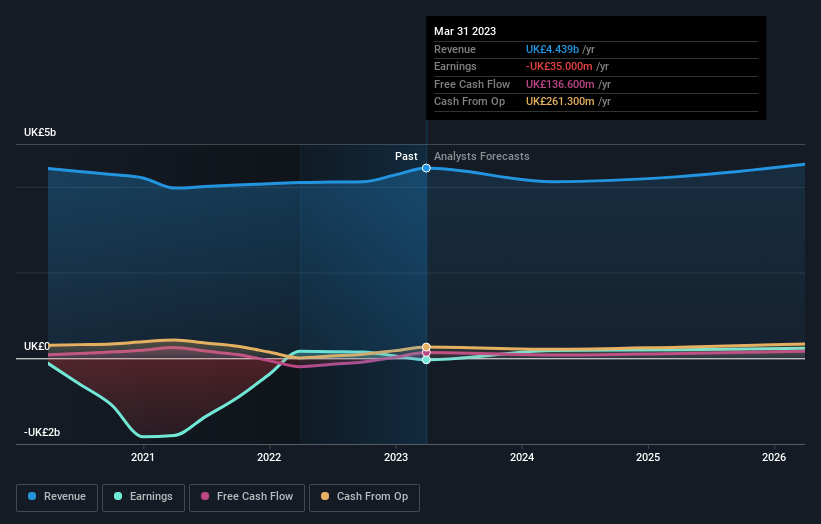
During five years of share price growth, Babcock International Group moved from a loss to profitability. However, it made a loss in the last twelve months, suggesting profit may be an unreliable metric at this stage. Other metrics might give us a better handle on how its value is changing over time.
The revenue decline of 2.4% isn't too bad. But it's quite possible the market had expected better; a closer look at the revenue trends might explain the pessimism.
The graphic below depicts how earnings and revenue have changed over time (unveil the exact values by clicking on the image).
If you are thinking of buying or selling Babcock International Group stock, you should check out this FREE detailed report on its balance sheet.
What About The Total Shareholder Return (TSR)?
We've already covered Babcock International Group's share price action, but we should also mention its total shareholder return (TSR). The TSR attempts to capture the value of dividends (as if they were reinvested) as well as any spin-offs or discounted capital raisings offered to shareholders. Its history of dividend payouts mean that Babcock International Group's TSR, which was a 41% drop over the last 5 years, was not as bad as the share price return.
A Different Perspective
We're pleased to report that Babcock International Group shareholders have received a total shareholder return of 16% over one year. There's no doubt those recent returns are much better than the TSR loss of 7% per year over five years. We generally put more weight on the long term performance over the short term, but the recent improvement could hint at a (positive) inflection point within the business. Shareholders might want to examine this detailed historical graph of past earnings, revenue and cash flow.
We will like Babcock International Group better if we see some big insider buys. While we wait, check out this free list of growing companies with considerable, recent, insider buying.
Please note, the market returns quoted in this article reflect the market weighted average returns of stocks that currently trade on British exchanges.
Valuation is complex, but we're here to simplify it.
Discover if Babcock International Group might be undervalued or overvalued with our detailed analysis, featuring fair value estimates, potential risks, dividends, insider trades, and its financial condition.
Access Free AnalysisHave feedback on this article? Concerned about the content? Get in touch with us directly. Alternatively, email editorial-team (at) simplywallst.com.
This article by Simply Wall St is general in nature. We provide commentary based on historical data and analyst forecasts only using an unbiased methodology and our articles are not intended to be financial advice. It does not constitute a recommendation to buy or sell any stock, and does not take account of your objectives, or your financial situation. We aim to bring you long-term focused analysis driven by fundamental data. Note that our analysis may not factor in the latest price-sensitive company announcements or qualitative material. Simply Wall St has no position in any stocks mentioned.
About LSE:BAB
Babcock International Group
Engages in the design, development, manufacture, and integration of specialist systems for aerospace, defense, and security in the United Kingdom, rest of Europe, Africa, North America, Australasia, and internationally.
Solid track record and good value.
Similar Companies
Market Insights

Community Narratives

