
Advertisement
To find a multi-bagger stock, what are the underlying trends we should look for in a business? Typically, we'll want to notice a trend of growing return on capital employed (ROCE) and alongside that, an expanding base of capital employed. Basically this means that a company has profitable initiatives that it can continue to reinvest in, which is a trait of a compounding machine. Having said that, from a first glance at Avation (LON:AVAP) we aren't jumping out of our chairs at how returns are trending, but let's have a deeper look.
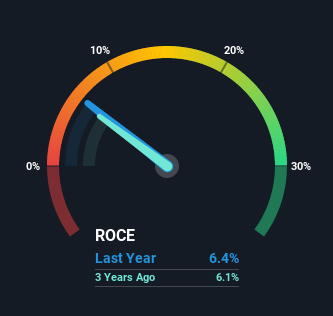
Understanding Return On Capital Employed (ROCE)
If you haven't worked with ROCE before, it measures the 'return' (pre-tax profit) a company generates from capital employed in its business. Analysts use this formula to calculate it for Avation:
Return on Capital Employed = Earnings Before Interest and Tax (EBIT) ÷ (Total Assets - Current Liabilities)
0.064 = US$57m ÷ (US$1.4b - US$467m) (Based on the trailing twelve months to December 2020).
So, Avation has an ROCE of 6.4%. In absolute terms, that's a low return and it also under-performs the Trade Distributors industry average of 14%.
See our latest analysis for Avation
In the above chart we have measured Avation's prior ROCE against its prior performance, but the future is arguably more important. If you'd like to see what analysts are forecasting going forward, you should check out our free report for Avation.
How Are Returns Trending?
In terms of Avation's historical ROCE trend, it doesn't exactly demand attention. Over the past five years, ROCE has remained relatively flat at around 6.4% and the business has deployed 55% more capital into its operations. Given the company has increased the amount of capital employed, it appears the investments that have been made simply don't provide a high return on capital.
On another note, while the change in ROCE trend might not scream for attention, it's interesting that the current liabilities have actually gone up over the last five years. This is intriguing because if current liabilities hadn't increased to 35% of total assets, this reported ROCE would probably be less than6.4% because total capital employed would be higher.The 6.4% ROCE could be even lower if current liabilities weren't 35% of total assets, because the the formula would show a larger base of total capital employed. So while current liabilities isn't high right now, keep an eye out in case it increases further, because this can introduce some elements of risk.
The Key Takeaway
As we've seen above, Avation's returns on capital haven't increased but it is reinvesting in the business. And in the last five years, the stock has given away 26% so the market doesn't look too hopeful on these trends strengthening any time soon. In any case, the stock doesn't have these traits of a multi-bagger discussed above, so if that's what you're looking for, we think you'd have more luck elsewhere.
One more thing: We've identified 3 warning signs with Avation (at least 1 which makes us a bit uncomfortable) , and understanding them would certainly be useful.
While Avation isn't earning the highest return, check out this free list of companies that are earning high returns on equity with solid balance sheets.
When trading Avation or any other investment, use the platform considered by many to be the Professional's Gateway to the Worlds Market, Interactive Brokers. You get the lowest-cost* trading on stocks, options, futures, forex, bonds and funds worldwide from a single integrated account. Promoted
New: Manage All Your Stock Portfolios in One Place
We've created the ultimate portfolio companion for stock investors, and it's free.
• Connect an unlimited number of Portfolios and see your total in one currency
• Be alerted to new Warning Signs or Risks via email or mobile
• Track the Fair Value of your stocks
This article by Simply Wall St is general in nature. We provide commentary based on historical data and analyst forecasts only using an unbiased methodology and our articles are not intended to be financial advice. It does not constitute a recommendation to buy or sell any stock, and does not take account of your objectives, or your financial situation. We aim to bring you long-term focused analysis driven by fundamental data. Note that our analysis may not factor in the latest price-sensitive company announcements or qualitative material. Simply Wall St has no position in any stocks mentioned.
*Interactive Brokers Rated Lowest Cost Broker by StockBrokers.com Annual Online Review 2020
Have feedback on this article? Concerned about the content? Get in touch with us directly. Alternatively, email editorial-team (at) simplywallst.com.
About LSE:AVAP
Avation
Avation PLC, together with its subsidiaries, leases commercial passenger aircraft to airlines in Europe and the Asia-Pacific.
Fair value with imperfect balance sheet.
Market Insights

Advertisement
Weekly Picks
FA

FAI on Arabian Internet and Communication Services ·
Solutions by stc: 34% Upside in Saudi's Digital Transformation Leader
Fair Value:ر.س342.2335.3% undervalued
9 followersusers have followed this narrative
1 commentusers have commented on this narrative
3 likesusers have liked this narrative
RO


RobertoAllende on NVIDIA ·
The AI Infrastructure Giant Grows Into Its Valuation
Fair Value:US$345.0747.9% undervalued
27 followersusers have followed this narrative
28 commentsusers have commented on this narrative
21 likesusers have liked this narrative
Recently Updated Narratives
HA

Haha94 on Perdana Petroleum Berhad ·
Perdana Petroleum Berhad is a Zombie Business with a 27.34% Profit Margin and inflation adjusted revenue Business
Fair Value:RM 0.2128.6% undervalued
1 followerusers have followed this narrative
0 commentsusers have commented on this narrative
0 likesusers have liked this narrative
AB
Abc on Global X Etfs Icav - Global X Silver Miners Ucits ETF ·
Many trends acting at the same time
Fair Value:€10068.5% undervalued
1 followerusers have followed this narrative
0 commentsusers have commented on this narrative
0 likesusers have liked this narrative
NI


niteco on Texas Instruments ·
Engineered for Stability. Positioned for Growth.
Fair Value:US$314.4446.5% undervalued
2 followersusers have followed this narrative
0 commentsusers have commented on this narrative
0 likesusers have liked this narrative
Popular Narratives
TH

TheWallstreetKing on MicroVision ·
MicroVision will explode future revenue by 380.37% with a vision towards success
Fair Value:US$6098.4% undervalued
109 followersusers have followed this narrative
11 commentsusers have commented on this narrative
22 likesusers have liked this narrative
AN

AnalystConsensusTarget on NVIDIA ·
NVDA: Expanding AI Demand Will Drive Major Data Center Investments Through 2026
Fair Value:US$250.3928.1% undervalued
941 followersusers have followed this narrative
6 commentsusers have commented on this narrative
24 likesusers have liked this narrative
OS


oscargarcia on Alphabet ·
The company that turned a verb into a global necessity and basically runs the modern internet, digital ads, smartphones, maps, and AI.
Fair Value:US$3407.4% undervalued
145 followersusers have followed this narrative
6 commentsusers have commented on this narrative
18 likesusers have liked this narrative