- United Kingdom
- /
- Electrical
- /
- AIM:VLX
The total return for Volex (LON:VLX) investors has risen faster than earnings growth over the last five years


It might be of some concern to shareholders to see the Volex plc (LON:VLX) share price down 13% in the last month. But that scarcely detracts from the really solid long term returns generated by the company over five years. Indeed, the share price is up an impressive 258% in that time. Generally speaking the long term returns will give you a better idea of business quality than short periods can. The more important question is whether the stock is too cheap or too expensive today.
While the stock has fallen 7.0% this week, it's worth focusing on the longer term and seeing if the stocks historical returns have been driven by the underlying fundamentals.
Check out our latest analysis for Volex
While the efficient markets hypothesis continues to be taught by some, it has been proven that markets are over-reactive dynamic systems, and investors are not always rational. One flawed but reasonable way to assess how sentiment around a company has changed is to compare the earnings per share (EPS) with the share price.
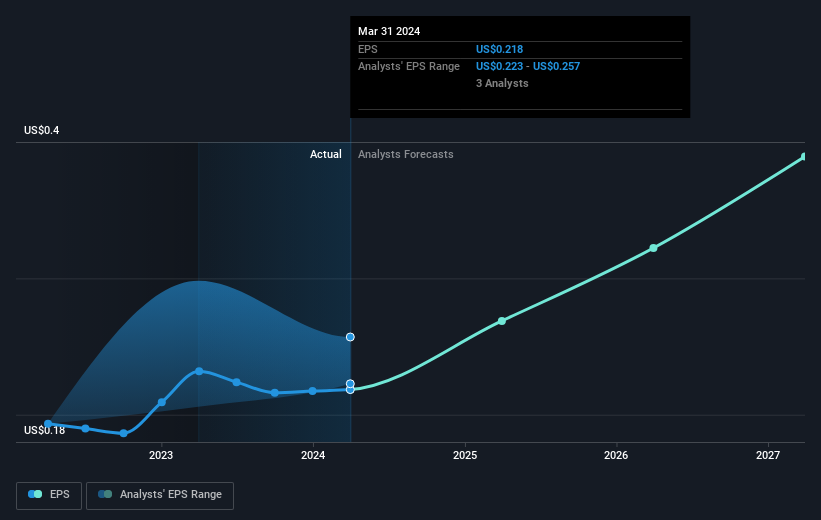
Over half a decade, Volex managed to grow its earnings per share at 26% a year. So the EPS growth rate is rather close to the annualized share price gain of 29% per year. Therefore one could conclude that sentiment towards the shares hasn't morphed very much. In fact, the share price seems to largely reflect the EPS growth.
The image below shows how EPS has tracked over time (if you click on the image you can see greater detail).
Before buying or selling a stock, we always recommend a close examination of historic growth trends, available here.
What About Dividends?
It is important to consider the total shareholder return, as well as the share price return, for any given stock. Whereas the share price return only reflects the change in the share price, the TSR includes the value of dividends (assuming they were reinvested) and the benefit of any discounted capital raising or spin-off. Arguably, the TSR gives a more comprehensive picture of the return generated by a stock. We note that for Volex the TSR over the last 5 years was 283%, which is better than the share price return mentioned above. This is largely a result of its dividend payments!
A Different Perspective
Volex shareholders are up 3.1% for the year (even including dividends). But that return falls short of the market. If we look back over five years, the returns are even better, coming in at 31% per year for five years. It's quite possible the business continues to execute with prowess, even as the share price gains are slowing. It's always interesting to track share price performance over the longer term. But to understand Volex better, we need to consider many other factors. Consider for instance, the ever-present spectre of investment risk. We've identified 1 warning sign with Volex , and understanding them should be part of your investment process.
If you are like me, then you will not want to miss this free list of undervalued small caps that insiders are buying.
Please note, the market returns quoted in this article reflect the market weighted average returns of stocks that currently trade on British exchanges.
New: Manage All Your Stock Portfolios in One Place
We've created the ultimate portfolio companion for stock investors, and it's free.
• Connect an unlimited number of Portfolios and see your total in one currency
• Be alerted to new Warning Signs or Risks via email or mobile
• Track the Fair Value of your stocks
Have feedback on this article? Concerned about the content? Get in touch with us directly. Alternatively, email editorial-team (at) simplywallst.com.
This article by Simply Wall St is general in nature. We provide commentary based on historical data and analyst forecasts only using an unbiased methodology and our articles are not intended to be financial advice. It does not constitute a recommendation to buy or sell any stock, and does not take account of your objectives, or your financial situation. We aim to bring you long-term focused analysis driven by fundamental data. Note that our analysis may not factor in the latest price-sensitive company announcements or qualitative material. Simply Wall St has no position in any stocks mentioned.
About AIM:VLX
Volex
Manufactures and sells power and data cables in North America, Europe, and Asia.
Undervalued with proven track record.
Market Insights

Community Narratives

