
Advertisement
- United Kingdom
- /
- Construction
- /
- AIM:RAI
If You Had Bought RA International Group (LON:RAI) Stock A Year Ago, You Could Pocket A 33% Gain Today
Passive investing in index funds can generate returns that roughly match the overall market. But if you pick the right individual stocks, you could make more than that. For example, the RA International Group PLC (LON:RAI) share price is up 33% in the last year, clearly besting the market decline of around 7.4% (not including dividends). That's a solid performance by our standards! Note that businesses generally develop over the long term, so the returns over the last year might not reflect a long term trend.
Check out our latest analysis for RA International Group
While markets are a powerful pricing mechanism, share prices reflect investor sentiment, not just underlying business performance. One imperfect but simple way to consider how the market perception of a company has shifted is to compare the change in the earnings per share (EPS) with the share price movement.
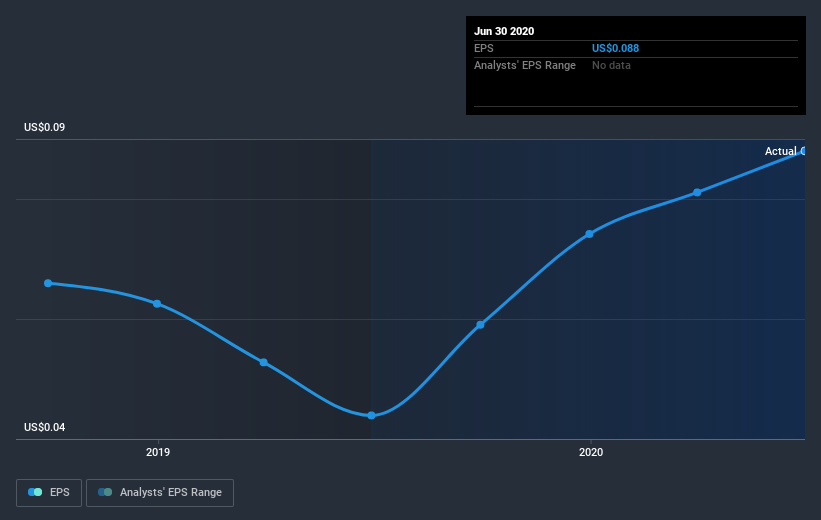
RA International Group was able to grow EPS by 100% in the last twelve months. It's fair to say that the share price gain of 33% did not keep pace with the EPS growth. So it seems like the market has cooled on RA International Group, despite the growth. Interesting. The caution is also evident in the lowish P/E ratio of 8.19.
You can see below how EPS has changed over time (discover the exact values by clicking on the image).
Before buying or selling a stock, we always recommend a close examination of historic growth trends, available here.
What About Dividends?
It is important to consider the total shareholder return, as well as the share price return, for any given stock. Whereas the share price return only reflects the change in the share price, the TSR includes the value of dividends (assuming they were reinvested) and the benefit of any discounted capital raising or spin-off. So for companies that pay a generous dividend, the TSR is often a lot higher than the share price return. As it happens, RA International Group's TSR for the last year was 37%, which exceeds the share price return mentioned earlier. The dividends paid by the company have thusly boosted the total shareholder return.
A Different Perspective
RA International Group boasts a total shareholder return of 37% for the last year (that includes the dividends) . And the share price momentum remains respectable, with a gain of 18% in the last three months. This suggests the company is continuing to win over new investors. I find it very interesting to look at share price over the long term as a proxy for business performance. But to truly gain insight, we need to consider other information, too. Case in point: We've spotted 2 warning signs for RA International Group you should be aware of, and 1 of them makes us a bit uncomfortable.
If you would prefer to check out another company -- one with potentially superior financials -- then do not miss this free list of companies that have proven they can grow earnings.
Please note, the market returns quoted in this article reflect the market weighted average returns of stocks that currently trade on GB exchanges.
If you’re looking to trade RA International Group, open an account with the lowest-cost* platform trusted by professionals, Interactive Brokers. Their clients from over 200 countries and territories trade stocks, options, futures, forex, bonds and funds worldwide from a single integrated account. Promoted
New: AI Stock Screener & Alerts
Our new AI Stock Screener scans the market every day to uncover opportunities.
• Dividend Powerhouses (3%+ Yield)
• Undervalued Small Caps with Insider Buying
• High growth Tech and AI Companies
Or build your own from over 50 metrics.
This article by Simply Wall St is general in nature. It does not constitute a recommendation to buy or sell any stock, and does not take account of your objectives, or your financial situation. We aim to bring you long-term focused analysis driven by fundamental data. Note that our analysis may not factor in the latest price-sensitive company announcements or qualitative material. Simply Wall St has no position in any stocks mentioned.
*Interactive Brokers Rated Lowest Cost Broker by StockBrokers.com Annual Online Review 2020
Have feedback on this article? Concerned about the content? Get in touch with us directly. Alternatively, email editorial-team (at) simplywallst.com.
About AIM:RAI
RA International Group
Provides construction, integrated facilities management, and supply chain services in demanding and remote areas in Africa and internationally.
Excellent balance sheet low.
Market Insights

Advertisement
Community Narratives
Finding The True Value Of A Logistics Powerhouse
Fair Value US$95.21|7.5% undervalued
NV
Community Contributor
Paradigm Biopharmaceuticals Will Lead Osteoarthritis Treatment with Zilosul's FDA Success
Fair Value AU$5.50|91.8% undervalued
AM
Community Contributor
Barrick Mining (ABX:CA): A Gold Hedge against a U.S. Shutdown
Fair Value CA$60.00|26.4% undervalued
GM
Community Contributor