- United Kingdom
- /
- Construction
- /
- AIM:NEXS
Here's What We Learned About The CEO Pay At Nexus Infrastructure plc (LON:NEXS)

Mike Morris became the CEO of Nexus Infrastructure plc (LON:NEXS) in 2006, and we think it's a good time to look at the executive's compensation against the backdrop of overall company performance. This analysis will also evaluate the appropriateness of CEO compensation when taking into account the earnings and shareholder returns of the company.
View our latest analysis for Nexus Infrastructure
Comparing Nexus Infrastructure plc's CEO Compensation With the industry
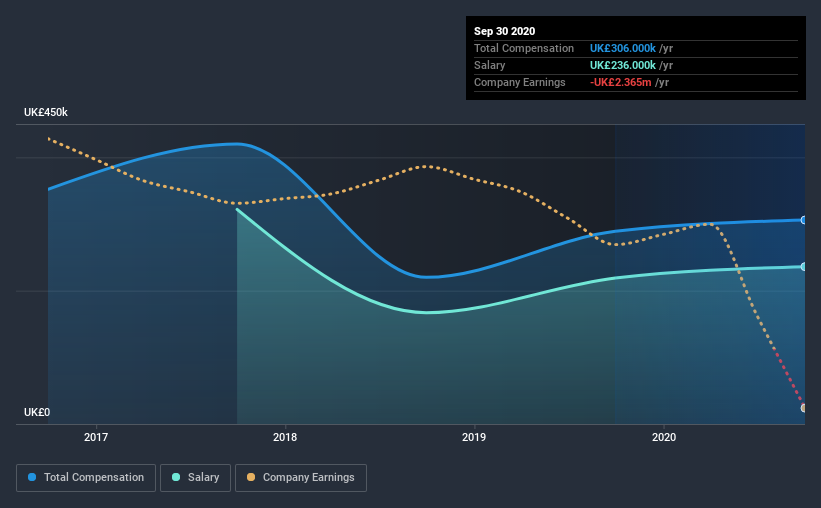
According to our data, Nexus Infrastructure plc has a market capitalization of UK£69m, and paid its CEO total annual compensation worth UK£306k over the year to September 2020. That's a fairly small increase of 5.9% over the previous year. Notably, the salary which is UK£236.0k, represents most of the total compensation being paid.
For comparison, other companies in the industry with market capitalizations below UK£144m, reported a median total CEO compensation of UK£393k. From this we gather that Mike Morris is paid around the median for CEOs in the industry. What's more, Mike Morris holds UK£15m worth of shares in the company in their own name, indicating that they have a lot of skin in the game.
| Component | 2020 | 2019 | Proportion (2020) |
| Salary | UK£236k | UK£219k | 77% |
| Other | UK£70k | UK£70k | 23% |
| Total Compensation | UK£306k | UK£289k | 100% |
Speaking on an industry level, nearly 63% of total compensation represents salary, while the remainder of 37% is other remuneration. Nexus Infrastructure pays out 77% of remuneration in the form of a salary, significantly higher than the industry average. If salary is the major component in total compensation, it suggests that the CEO receives a higher fixed proportion of the total compensation, regardless of performance.

A Look at Nexus Infrastructure plc's Growth Numbers
Over the last three years, Nexus Infrastructure plc has shrunk its earnings per share by 39% per year. Its revenue is down 19% over the previous year.
Few shareholders would be pleased to read that EPS have declined. And the fact that revenue is down year on year arguably paints an ugly picture. It's hard to argue the company is firing on all cylinders, so shareholders might be averse to high CEO remuneration. Looking ahead, you might want to check this free visual report on analyst forecasts for the company's future earnings..
Has Nexus Infrastructure plc Been A Good Investment?
With a three year total loss of 34% for the shareholders, Nexus Infrastructure plc would certainly have some dissatisfied shareholders. Therefore, it might be upsetting for shareholders if the CEO were paid generously.
To Conclude...
As previously discussed, Mike is compensated close to the median for companies of its size, and which belong to the same industry. In the meantime, the company has reported declining EPS growth and shareholder returns over the last three years. It's tough to call out the compensation as inappropriate, but shareholders might not favor a raise before company performance improves.
CEO pay is simply one of the many factors that need to be considered while examining business performance. We identified 3 warning signs for Nexus Infrastructure (1 is potentially serious!) that you should be aware of before investing here.
Switching gears from Nexus Infrastructure, if you're hunting for a pristine balance sheet and premium returns, this free list of high return, low debt companies is a great place to look.
If you decide to trade Nexus Infrastructure, use the lowest-cost* platform that is rated #1 Overall by Barron’s, Interactive Brokers. Trade stocks, options, futures, forex, bonds and funds on 135 markets, all from a single integrated account. Promoted
If you're looking to trade Nexus Infrastructure, open an account with the lowest-cost platform trusted by professionals, Interactive Brokers.
With clients in over 200 countries and territories, and access to 160 markets, IBKR lets you trade stocks, options, futures, forex, bonds and funds from a single integrated account.
Enjoy no hidden fees, no account minimums, and FX conversion rates as low as 0.03%, far better than what most brokers offer.
Sponsored ContentValuation is complex, but we're here to simplify it.
Discover if Nexus Infrastructure might be undervalued or overvalued with our detailed analysis, featuring fair value estimates, potential risks, dividends, insider trades, and its financial condition.
Access Free AnalysisThis article by Simply Wall St is general in nature. It does not constitute a recommendation to buy or sell any stock, and does not take account of your objectives, or your financial situation. We aim to bring you long-term focused analysis driven by fundamental data. Note that our analysis may not factor in the latest price-sensitive company announcements or qualitative material. Simply Wall St has no position in any stocks mentioned.
*Interactive Brokers Rated Lowest Cost Broker by StockBrokers.com Annual Online Review 2020
Have feedback on this article? Concerned about the content? Get in touch with us directly. Alternatively, email editorial-team (at) simplywallst.com.
About AIM:NEXS
Nexus Infrastructure
Through its subsidiaries, develops and delivers infrastructure solutions.
Flawless balance sheet and slightly overvalued.
Market Insights
Community Narratives


