
Advertisement
- United Kingdom
- /
- Machinery
- /
- AIM:JDG
Judges Scientific (LON:JDG) shareholders notch a 11% CAGR over 5 years, yet earnings have been shrinking

Stock pickers are generally looking for stocks that will outperform the broader market. And while active stock picking involves risks (and requires diversification) it can also provide excess returns. To wit, the Judges Scientific share price has climbed 59% in five years, easily topping the market return of 27% (ignoring dividends).
Since it's been a strong week for Judges Scientific shareholders, let's have a look at trend of the longer term fundamentals.
While markets are a powerful pricing mechanism, share prices reflect investor sentiment, not just underlying business performance. By comparing earnings per share (EPS) and share price changes over time, we can get a feel for how investor attitudes to a company have morphed over time.
Judges Scientific's earnings per share are down 3.1% per year, despite strong share price performance over five years.
By glancing at these numbers, we'd posit that the decline in earnings per share is not representative of how the business has changed over the years. Therefore, it's worth taking a look at other metrics to try to understand the share price movements.
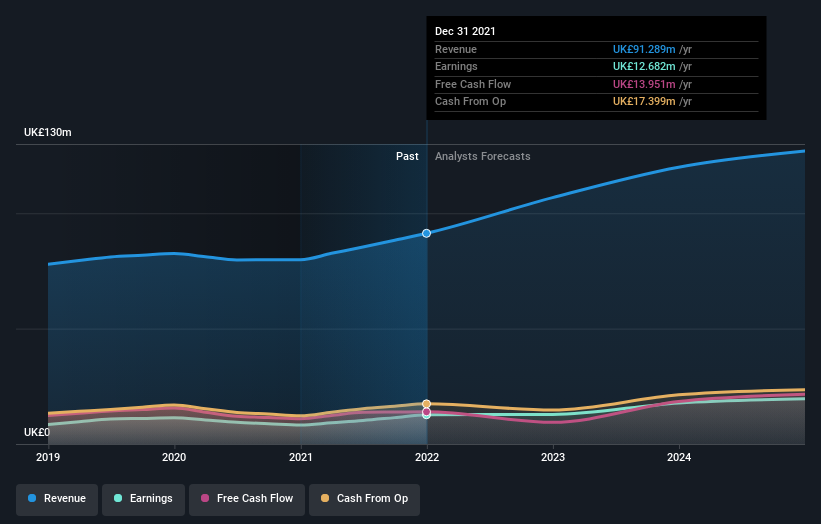
The modest 1.4% dividend yield is unlikely to be propping up the share price. In contrast revenue growth of 14% per year is probably viewed as evidence that Judges Scientific is growing, a real positive. It's quite possible that management are prioritizing revenue growth over EPS growth at the moment.
You can see below how earnings and revenue have changed over time (discover the exact values by clicking on the image).
We like that insiders have been buying shares in the last twelve months. Having said that, most people consider earnings and revenue growth trends to be a more meaningful guide to the business. This free report showing analyst forecasts should help you form a view on Judges Scientific
What About Dividends?
When looking at investment returns, it is important to consider the difference between total shareholder return (TSR) and share price return. The TSR is a return calculation that accounts for the value of cash dividends (assuming that any dividend received was reinvested) and the calculated value of any discounted capital raisings and spin-offs. So for companies that pay a generous dividend, the TSR is often a lot higher than the share price return. In the case of Judges Scientific, it has a TSR of 66% for the last 5 years. That exceeds its share price return that we previously mentioned. This is largely a result of its dividend payments!
A Different Perspective
Investors in Judges Scientific had a tough year, with a total loss of 37% (including dividends), against a market gain of about 4.3%. Even the share prices of good stocks drop sometimes, but we want to see improvements in the fundamental metrics of a business, before getting too interested. Longer term investors wouldn't be so upset, since they would have made 11%, each year, over five years. If the fundamental data continues to indicate long term sustainable growth, the current sell-off could be an opportunity worth considering. While it is well worth considering the different impacts that market conditions can have on the share price, there are other factors that are even more important. For instance, we've identified 1 warning sign for Judges Scientific that you should be aware of.
Judges Scientific is not the only stock insiders are buying. So take a peek at this free list of small cap companies at attractive valuations which insiders have been buying.
Please note, the market returns quoted in this article reflect the market weighted average returns of stocks that currently trade on British exchanges.
New: Manage All Your Stock Portfolios in One Place
We've created the ultimate portfolio companion for stock investors, and it's free.
• Connect an unlimited number of Portfolios and see your total in one currency
• Be alerted to new Warning Signs or Risks via email or mobile
• Track the Fair Value of your stocks
Have feedback on this article? Concerned about the content? Get in touch with us directly. Alternatively, email editorial-team (at) simplywallst.com.
This article by Simply Wall St is general in nature. We provide commentary based on historical data and analyst forecasts only using an unbiased methodology and our articles are not intended to be financial advice. It does not constitute a recommendation to buy or sell any stock, and does not take account of your objectives, or your financial situation. We aim to bring you long-term focused analysis driven by fundamental data. Note that our analysis may not factor in the latest price-sensitive company announcements or qualitative material. Simply Wall St has no position in any stocks mentioned.
About AIM:JDG
Judges Scientific
Designs, manufactures, and sells scientific instruments and services.
High growth potential with solid track record and pays a dividend.
Market Insights

Advertisement
Community Narratives
WhiteCap Is Positioned To Profit Regardless Of Trump's Policy 
Fair Value CA$22.60|61.6% undervalued
ST
Equity Analyst and Writer
Microsoft's Evolution Will Drive Revenue to New Heights Fueled by AI
Fair Value US$360.00|28.3% overvalued
BR
Community Contributor
A CASE FOR USD$2.50 (CAD$3.44) BY 2028 (A 5-10 BAGGER)
Fair Value CA$3.44|87.8% undervalued
AG
Community Contributor