
Advertisement
- United Kingdom
- /
- Trade Distributors
- /
- AIM:FLO
Estimating The Intrinsic Value Of Flowtech Fluidpower plc (LON:FLO)
Key Insights
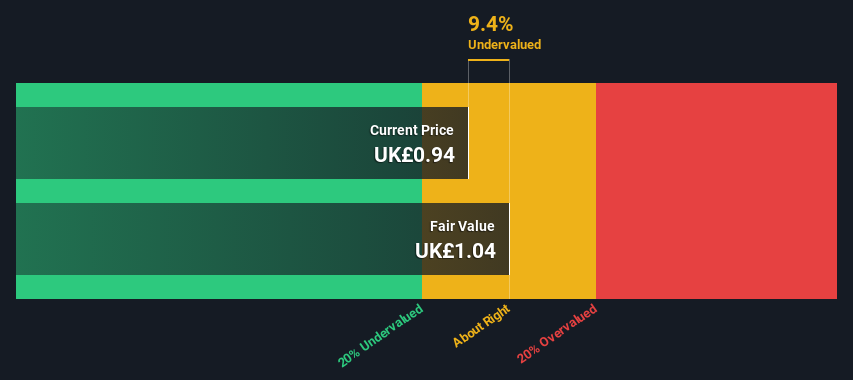
- The projected fair value for Flowtech Fluidpower is UK£1.04 based on 2 Stage Free Cash Flow to Equity
- Flowtech Fluidpower's UK£0.94 share price indicates it is trading at similar levels as its fair value estimate
- The average premium for Flowtech Fluidpower's competitorsis currently 89%
Today we will run through one way of estimating the intrinsic value of Flowtech Fluidpower plc (LON:FLO) by taking the expected future cash flows and discounting them to today's value. We will take advantage of the Discounted Cash Flow (DCF) model for this purpose. Don't get put off by the jargon, the math behind it is actually quite straightforward.
Companies can be valued in a lot of ways, so we would point out that a DCF is not perfect for every situation. If you want to learn more about discounted cash flow, the rationale behind this calculation can be read in detail in the Simply Wall St analysis model.
View our latest analysis for Flowtech Fluidpower
Step By Step Through The Calculation
We are going to use a two-stage DCF model, which, as the name states, takes into account two stages of growth. The first stage is generally a higher growth period which levels off heading towards the terminal value, captured in the second 'steady growth' period. In the first stage we need to estimate the cash flows to the business over the next ten years. Where possible we use analyst estimates, but when these aren't available we extrapolate the previous free cash flow (FCF) from the last estimate or reported value. We assume companies with shrinking free cash flow will slow their rate of shrinkage, and that companies with growing free cash flow will see their growth rate slow, over this period. We do this to reflect that growth tends to slow more in the early years than it does in later years.
A DCF is all about the idea that a dollar in the future is less valuable than a dollar today, and so the sum of these future cash flows is then discounted to today's value:
10-year free cash flow (FCF) forecast
| 2024 | 2025 | 2026 | 2027 | 2028 | 2029 | 2030 | 2031 | 2032 | 2033 | |
| Levered FCF (£, Millions) | UK£6.90m | UK£6.10m | UK£5.64m | UK£5.36m | UK£5.19m | UK£5.10m | UK£5.06m | UK£5.06m | UK£5.07m | UK£5.11m |
| Growth Rate Estimate Source | Analyst x1 | Est @ -11.52% | Est @ -7.65% | Est @ -4.94% | Est @ -3.04% | Est @ -1.72% | Est @ -0.79% | Est @ -0.14% | Est @ 0.32% | Est @ 0.64% |
| Present Value (£, Millions) Discounted @ 9.1% | UK£6.3 | UK£5.1 | UK£4.3 | UK£3.8 | UK£3.4 | UK£3.0 | UK£2.8 | UK£2.5 | UK£2.3 | UK£2.1 |
("Est" = FCF growth rate estimated by Simply Wall St)
Present Value of 10-year Cash Flow (PVCF) = UK£36m
The second stage is also known as Terminal Value, this is the business's cash flow after the first stage. The Gordon Growth formula is used to calculate Terminal Value at a future annual growth rate equal to the 5-year average of the 10-year government bond yield of 1.4%. We discount the terminal cash flows to today's value at a cost of equity of 9.1%.
Terminal Value (TV)= FCF2033 × (1 + g) ÷ (r – g) = UK£5.1m× (1 + 1.4%) ÷ (9.1%– 1.4%) = UK£67m
Present Value of Terminal Value (PVTV)= TV / (1 + r)10= UK£67m÷ ( 1 + 9.1%)10= UK£28m
The total value, or equity value, is then the sum of the present value of the future cash flows, which in this case is UK£64m. To get the intrinsic value per share, we divide this by the total number of shares outstanding. Compared to the current share price of UK£0.9, the company appears about fair value at a 9.4% discount to where the stock price trades currently. Valuations are imprecise instruments though, rather like a telescope - move a few degrees and end up in a different galaxy. Do keep this in mind.
Important Assumptions
The calculation above is very dependent on two assumptions. The first is the discount rate and the other is the cash flows. If you don't agree with these result, have a go at the calculation yourself and play with the assumptions. The DCF also does not consider the possible cyclicality of an industry, or a company's future capital requirements, so it does not give a full picture of a company's potential performance. Given that we are looking at Flowtech Fluidpower as potential shareholders, the cost of equity is used as the discount rate, rather than the cost of capital (or weighted average cost of capital, WACC) which accounts for debt. In this calculation we've used 9.1%, which is based on a levered beta of 1.305. Beta is a measure of a stock's volatility, compared to the market as a whole. We get our beta from the industry average beta of globally comparable companies, with an imposed limit between 0.8 and 2.0, which is a reasonable range for a stable business.
SWOT Analysis for Flowtech Fluidpower
Strength
- Debt is not viewed as a risk.
Weakness
- Dividend is low compared to the top 25% of dividend payers in the Trade Distributors market.
Opportunity
- Has sufficient cash runway for more than 3 years based on current free cash flows.
- Good value based on P/S ratio and estimated fair value.
Threat
- Paying a dividend but company is unprofitable.
Next Steps:
Whilst important, the DCF calculation shouldn't be the only metric you look at when researching a company. It's not possible to obtain a foolproof valuation with a DCF model. Instead the best use for a DCF model is to test certain assumptions and theories to see if they would lead to the company being undervalued or overvalued. For instance, if the terminal value growth rate is adjusted slightly, it can dramatically alter the overall result. For Flowtech Fluidpower, there are three important aspects you should assess:
- Risks: Every company has them, and we've spotted 3 warning signs for Flowtech Fluidpower (of which 1 makes us a bit uncomfortable!) you should know about.
- Future Earnings: How does FLO's growth rate compare to its peers and the wider market? Dig deeper into the analyst consensus number for the upcoming years by interacting with our free analyst growth expectation chart.
- Other High Quality Alternatives: Do you like a good all-rounder? Explore our interactive list of high quality stocks to get an idea of what else is out there you may be missing!
PS. The Simply Wall St app conducts a discounted cash flow valuation for every stock on the AIM every day. If you want to find the calculation for other stocks just search here.
New: AI Stock Screener & Alerts
Our new AI Stock Screener scans the market every day to uncover opportunities.
• Dividend Powerhouses (3%+ Yield)
• Undervalued Small Caps with Insider Buying
• High growth Tech and AI Companies
Or build your own from over 50 metrics.
Have feedback on this article? Concerned about the content? Get in touch with us directly. Alternatively, email editorial-team (at) simplywallst.com.
This article by Simply Wall St is general in nature. We provide commentary based on historical data and analyst forecasts only using an unbiased methodology and our articles are not intended to be financial advice. It does not constitute a recommendation to buy or sell any stock, and does not take account of your objectives, or your financial situation. We aim to bring you long-term focused analysis driven by fundamental data. Note that our analysis may not factor in the latest price-sensitive company announcements or qualitative material. Simply Wall St has no position in any stocks mentioned.
About AIM:FLO
Flowtech Fluidpower
Distributes engineering components and assemblies in the areas of fluid power industry in the United Kingdom, The Netherlands, Belgium, and Ireland.
Reasonable growth potential with adequate balance sheet.
Market Insights

Advertisement
Community Narratives
MINISO's fair value is projected at 26.69 with an anticipated PE ratio shift of 20x
Fair Value US$24.03|11.0% undervalued
BE
Community Contributor
Procter & Gamble: A Dividend Giant Facing Slowing Growth
Fair Value US$119.81|23.3% overvalued
AN
Community Contributor
Eli Lilly's Future Growth Driven by Tirzepatide and Favorable Market Conditions
Fair Value US$1.19k|13.8% undervalued
EA
Community Contributor