Stock Analysis
- United Kingdom
- /
- Banks
- /
- LSE:TBCG
TBC Bank Group (LON:TBCG) sheds 10% this week, as yearly returns fall more in line with earnings growth


It might be of some concern to shareholders to see the TBC Bank Group PLC (LON:TBCG) share price down 10% in the last month. In contrast, the return over three years has been impressive. In fact, the share price is up a full 178% compared to three years ago. To some, the recent share price pullback wouldn't be surprising after such a good run. The thing to consider is whether the underlying business is doing well enough to support the current price.
While this past week has detracted from the company's three-year return, let's look at the recent trends of the underlying business and see if the gains have been in alignment.
Check out our latest analysis for TBC Bank Group
To quote Buffett, 'Ships will sail around the world but the Flat Earth Society will flourish. There will continue to be wide discrepancies between price and value in the marketplace...' One flawed but reasonable way to assess how sentiment around a company has changed is to compare the earnings per share (EPS) with the share price.
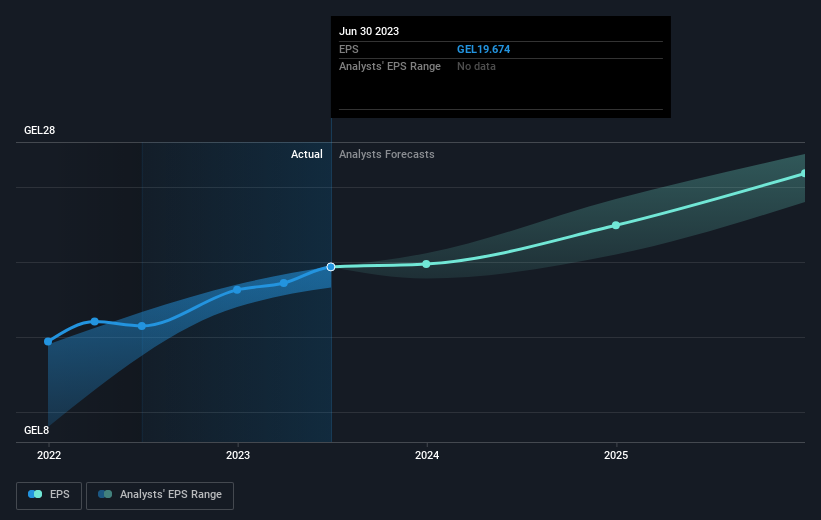
During three years of share price growth, TBC Bank Group achieved compound earnings per share growth of 45% per year. We don't think it is entirely coincidental that the EPS growth is reasonably close to the 41% average annual increase in the share price. This suggests that sentiment and expectations have not changed drastically. Au contraire, the share price change has arguably mimicked the EPS growth.
You can see below how EPS has changed over time (discover the exact values by clicking on the image).
It is of course excellent to see how TBC Bank Group has grown profits over the years, but the future is more important for shareholders. Take a more thorough look at TBC Bank Group's financial health with this free report on its balance sheet.
What About Dividends?
As well as measuring the share price return, investors should also consider the total shareholder return (TSR). The TSR incorporates the value of any spin-offs or discounted capital raisings, along with any dividends, based on the assumption that the dividends are reinvested. So for companies that pay a generous dividend, the TSR is often a lot higher than the share price return. We note that for TBC Bank Group the TSR over the last 3 years was 232%, which is better than the share price return mentioned above. The dividends paid by the company have thusly boosted the total shareholder return.
A Different Perspective
We're pleased to report that TBC Bank Group shareholders have received a total shareholder return of 58% over one year. And that does include the dividend. That's better than the annualised return of 16% over half a decade, implying that the company is doing better recently. Someone with an optimistic perspective could view the recent improvement in TSR as indicating that the business itself is getting better with time. I find it very interesting to look at share price over the long term as a proxy for business performance. But to truly gain insight, we need to consider other information, too. For example, we've discovered 1 warning sign for TBC Bank Group that you should be aware of before investing here.
For those who like to find winning investments this free list of growing companies with recent insider purchasing, could be just the ticket.
Please note, the market returns quoted in this article reflect the market weighted average returns of stocks that currently trade on British exchanges.
Valuation is complex, but we're helping make it simple.
Find out whether TBC Bank Group is potentially over or undervalued by checking out our comprehensive analysis, which includes fair value estimates, risks and warnings, dividends, insider transactions and financial health.
View the Free AnalysisHave feedback on this article? Concerned about the content? Get in touch with us directly. Alternatively, email editorial-team (at) simplywallst.com.
This article by Simply Wall St is general in nature. We provide commentary based on historical data and analyst forecasts only using an unbiased methodology and our articles are not intended to be financial advice. It does not constitute a recommendation to buy or sell any stock, and does not take account of your objectives, or your financial situation. We aim to bring you long-term focused analysis driven by fundamental data. Note that our analysis may not factor in the latest price-sensitive company announcements or qualitative material. Simply Wall St has no position in any stocks mentioned.
About LSE:TBCG
TBC Bank Group
Through its subsidiaries, provides banking, leasing, insurance, brokerage, and card processing services to corporate and individual customers in Georgia, Azerbaijan, and Uzbekistan.
Undervalued with reasonable growth potential and pays a dividend.
