
Advertisement
- France
- /
- Renewable Energy
- /
- ENXTPA:VLTSA
Investors Still Aren't Entirely Convinced By Voltalia SA's (EPA:VLTSA) Revenues Despite 27% Price Jump
Voltalia SA (EPA:VLTSA) shares have had a really impressive month, gaining 27% after a shaky period beforehand. But the gains over the last month weren't enough to make shareholders whole, as the share price is still down 8.3% in the last twelve months.
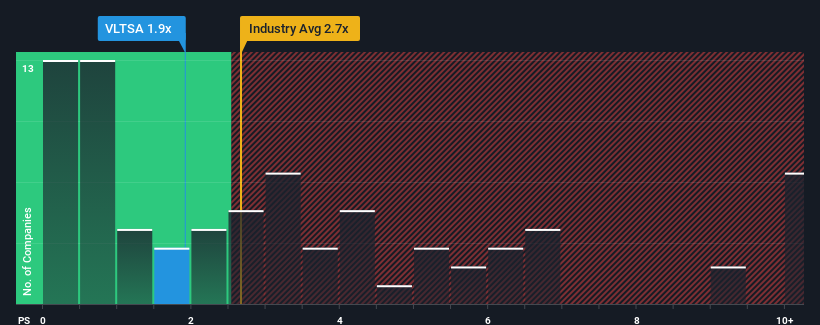
In spite of the firm bounce in price, Voltalia may still be sending very bullish signals at the moment with its price-to-sales (or "P/S") ratio of 1.9x, since almost half of all companies in the Renewable Energy industry in France have P/S ratios greater than 4x and even P/S higher than 9x are not unusual. However, the P/S might be quite low for a reason and it requires further investigation to determine if it's justified.
See our latest analysis for Voltalia
What Does Voltalia's P/S Mean For Shareholders?
Voltalia could be doing better as it's been growing revenue less than most other companies lately. The P/S ratio is probably low because investors think this lacklustre revenue performance isn't going to get any better. If this is the case, then existing shareholders will probably struggle to get excited about the future direction of the share price.
Want the full picture on analyst estimates for the company? Then our free report on Voltalia will help you uncover what's on the horizon.Is There Any Revenue Growth Forecasted For Voltalia?
There's an inherent assumption that a company should far underperform the industry for P/S ratios like Voltalia's to be considered reasonable.
Taking a look back first, we see that the company managed to grow revenues by a handy 10% last year. Pleasingly, revenue has also lifted 52% in aggregate from three years ago, partly thanks to the last 12 months of growth. So we can start by confirming that the company has done a great job of growing revenues over that time.
Turning to the outlook, the next three years should generate growth of 9.9% per annum as estimated by the five analysts watching the company. Meanwhile, the rest of the industry is forecast to only expand by 5.1% each year, which is noticeably less attractive.
With this in consideration, we find it intriguing that Voltalia's P/S sits behind most of its industry peers. Apparently some shareholders are doubtful of the forecasts and have been accepting significantly lower selling prices.
The Bottom Line On Voltalia's P/S
Voltalia's recent share price jump still sees fails to bring its P/S alongside the industry median. Typically, we'd caution against reading too much into price-to-sales ratios when settling on investment decisions, though it can reveal plenty about what other market participants think about the company.
To us, it seems Voltalia currently trades on a significantly depressed P/S given its forecasted revenue growth is higher than the rest of its industry. There could be some major risk factors that are placing downward pressure on the P/S ratio. At least price risks look to be very low, but investors seem to think future revenues could see a lot of volatility.
And what about other risks? Every company has them, and we've spotted 1 warning sign for Voltalia you should know about.
If strong companies turning a profit tickle your fancy, then you'll want to check out this free list of interesting companies that trade on a low P/E (but have proven they can grow earnings).
New: Manage All Your Stock Portfolios in One Place
We've created the ultimate portfolio companion for stock investors, and it's free.
• Connect an unlimited number of Portfolios and see your total in one currency
• Be alerted to new Warning Signs or Risks via email or mobile
• Track the Fair Value of your stocks
Have feedback on this article? Concerned about the content? Get in touch with us directly. Alternatively, email editorial-team (at) simplywallst.com.
This article by Simply Wall St is general in nature. We provide commentary based on historical data and analyst forecasts only using an unbiased methodology and our articles are not intended to be financial advice. It does not constitute a recommendation to buy or sell any stock, and does not take account of your objectives, or your financial situation. We aim to bring you long-term focused analysis driven by fundamental data. Note that our analysis may not factor in the latest price-sensitive company announcements or qualitative material. Simply Wall St has no position in any stocks mentioned.
About ENXTPA:VLTSA
Voltalia
Engages in the production and sale of energy generated by the wind, solar, hydropower, biomass, and storage plants.
Reasonable growth potential and fair value.
Similar Companies
Market Insights

Advertisement
Weekly Picks
RO


RockeTeller on Santacruz Silver Mining ·
Crazy Undervalued 42 Baggers Silver Play (Active & Running Mine)
Fair Value:CA$8696.7% undervalued
74 followersusers have followed this narrative
7 commentsusers have commented on this narrative
21 likesusers have liked this narrative
RO


Robbo on Fiducian Group ·
Fiducian: Compliance Clouds or Value Opportunity?
Fair Value:AU$121.2% undervalued
13 followersusers have followed this narrative
0 commentsusers have commented on this narrative
1 likeusers have liked this narrative
WO

woodworthfund on Willamette Valley Vineyards ·
Willamette Valley Vineyards (WVVI): Not-So-Great Value
Fair Value:US$245.0% overvalued
11 followersusers have followed this narrative
0 commentsusers have commented on this narrative
1 likeusers have liked this narrative
Recently Updated Narratives
NO

Norms70 on Standard Lithium ·
SLI is share to watch next 5 years
Fair Value:€4.59.8% undervalued
1 followerusers have followed this narrative
0 commentsusers have commented on this narrative
0 likesusers have liked this narrative
DA


davidlsander on Beam Therapeutics ·
The "Molecular Pencil": Why Beam's Technology is Built to Win
Fair Value:US$15081.9% undervalued
59 followersusers have followed this narrative
3 commentsusers have commented on this narrative
0 likesusers have liked this narrative
RE

RedhawkCC on Prime Medicine ·
PRME remains a long shot but publication in the New England Journal of Medicine helps.
Fair Value:US$0.0469.1k% overvalued
1 followerusers have followed this narrative
0 commentsusers have commented on this narrative
0 likesusers have liked this narrative
Popular Narratives
TH


TheWallstreetKing on MicroVision ·
MicroVision will explode future revenue by 380.37% with a vision towards success
Fair Value:US$6098.5% undervalued
118 followersusers have followed this narrative
11 commentsusers have commented on this narrative
22 likesusers have liked this narrative
AN


AnalystConsensusTarget on NVIDIA ·
NVDA: Expanding AI Demand Will Drive Major Data Center Investments Through 2026
Fair Value:US$250.3925.9% undervalued
962 followersusers have followed this narrative
6 commentsusers have commented on this narrative
25 likesusers have liked this narrative
RO
RockeTeller on Santacruz Silver Mining ·
Crazy Undervalued 42 Baggers Silver Play (Active & Running Mine)
Fair Value:CA$8696.7% undervalued
74 followersusers have followed this narrative
7 commentsusers have commented on this narrative
21 likesusers have liked this narrative
