- France
- /
- Transportation
- /
- ENXTPA:STF
Will Weakness in STEF SA's (EPA:STF) Stock Prove Temporary Given Strong Fundamentals?


It is hard to get excited after looking at STEF's (EPA:STF) recent performance, when its stock has declined 4.3% over the past three months. However, stock prices are usually driven by a company’s financial performance over the long term, which in this case looks quite promising. In this article, we decided to focus on STEF's ROE.
Return on equity or ROE is an important factor to be considered by a shareholder because it tells them how effectively their capital is being reinvested. Put another way, it reveals the company's success at turning shareholder investments into profits.
Check out our latest analysis for STEF
How Do You Calculate Return On Equity?
ROE can be calculated by using the formula:
Return on Equity = Net Profit (from continuing operations) ÷ Shareholders' Equity
So, based on the above formula, the ROE for STEF is:
14% = €164m ÷ €1.2b (Based on the trailing twelve months to June 2024).
The 'return' is the yearly profit. That means that for every €1 worth of shareholders' equity, the company generated €0.14 in profit.
What Is The Relationship Between ROE And Earnings Growth?
So far, we've learned that ROE is a measure of a company's profitability. Based on how much of its profits the company chooses to reinvest or "retain", we are then able to evaluate a company's future ability to generate profits. Assuming everything else remains unchanged, the higher the ROE and profit retention, the higher the growth rate of a company compared to companies that don't necessarily bear these characteristics.
STEF's Earnings Growth And 14% ROE
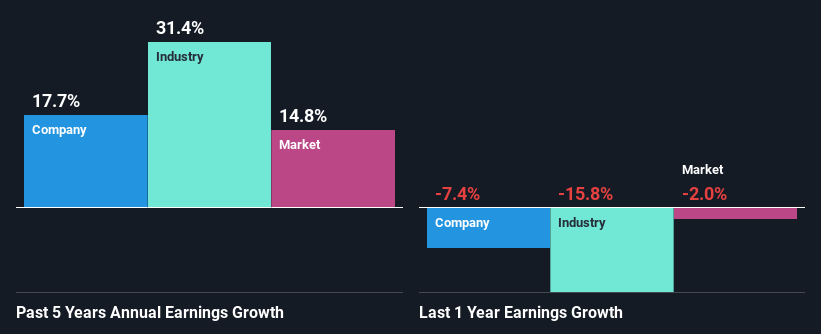
At first glance, STEF seems to have a decent ROE. On comparing with the average industry ROE of 11% the company's ROE looks pretty remarkable. This probably laid the ground for STEF's moderate 18% net income growth seen over the past five years.
We then compared STEF's net income growth with the industry and found that the company's growth figure is lower than the average industry growth rate of 31% in the same 5-year period, which is a bit concerning.
Earnings growth is an important metric to consider when valuing a stock. What investors need to determine next is if the expected earnings growth, or the lack of it, is already built into the share price. By doing so, they will have an idea if the stock is headed into clear blue waters or if swampy waters await. What is STF worth today? The intrinsic value infographic in our free research report helps visualize whether STF is currently mispriced by the market.
Is STEF Efficiently Re-investing Its Profits?
STEF has a healthy combination of a moderate three-year median payout ratio of 28% (or a retention ratio of 72%) and a respectable amount of growth in earnings as we saw above, meaning that the company has been making efficient use of its profits.
Moreover, STEF is determined to keep sharing its profits with shareholders which we infer from its long history of paying a dividend for at least ten years. Our latest analyst data shows that the future payout ratio of the company is expected to rise to 36% over the next three years. However, the company's ROE is not expected to change by much despite the higher expected payout ratio.
Summary
On the whole, we feel that STEF's performance has been quite good. Particularly, we like that the company is reinvesting heavily into its business, and at a high rate of return. As a result, the decent growth in its earnings is not surprising. Having said that, the company's earnings growth is expected to slow down, as forecasted in the current analyst estimates. Are these analysts expectations based on the broad expectations for the industry, or on the company's fundamentals? Click here to be taken to our analyst's forecasts page for the company.
New: Manage All Your Stock Portfolios in One Place
We've created the ultimate portfolio companion for stock investors, and it's free.
• Connect an unlimited number of Portfolios and see your total in one currency
• Be alerted to new Warning Signs or Risks via email or mobile
• Track the Fair Value of your stocks
Have feedback on this article? Concerned about the content? Get in touch with us directly. Alternatively, email editorial-team (at) simplywallst.com.
This article by Simply Wall St is general in nature. We provide commentary based on historical data and analyst forecasts only using an unbiased methodology and our articles are not intended to be financial advice. It does not constitute a recommendation to buy or sell any stock, and does not take account of your objectives, or your financial situation. We aim to bring you long-term focused analysis driven by fundamental data. Note that our analysis may not factor in the latest price-sensitive company announcements or qualitative material. Simply Wall St has no position in any stocks mentioned.
About ENXTPA:STF
STEF
Provides temperature-controlled road transport and logistics services for agri-food industry, and out-of-home foodservices.
Undervalued with adequate balance sheet.
Similar Companies
Market Insights

Community Narratives

