- France
- /
- Tech Hardware
- /
- ENXTPA:QDT
What Is Quadient SAS's (EPA:QDT) P/E Ratio After Its Share Price Tanked?

Unfortunately for some shareholders, the Quadient SAS (EPA:QDT) share price has dived 35% in the last thirty days. Indeed the recent decline has arguably caused some bitterness for shareholders who have held through the 37% drop over twelve months.
All else being equal, a share price drop should make a stock more attractive to potential investors. In the long term, share prices tend to follow earnings per share, but in the short term prices bounce around in response to short term factors (which are not always obvious). The implication here is that long term investors have an opportunity when expectations of a company are too low. One way to gauge market expectations of a stock is to look at its Price to Earnings Ratio (PE Ratio). Investors have optimistic expectations of companies with higher P/E ratios, compared to companies with lower P/E ratios.
View our latest analysis for Quadient SAS
Does Quadient SAS Have A Relatively High Or Low P/E For Its Industry?
Quadient SAS's P/E of 6.80 indicates relatively low sentiment towards the stock. We can see in the image below that the average P/E (26.9) for companies in the tech industry is higher than Quadient SAS's P/E.
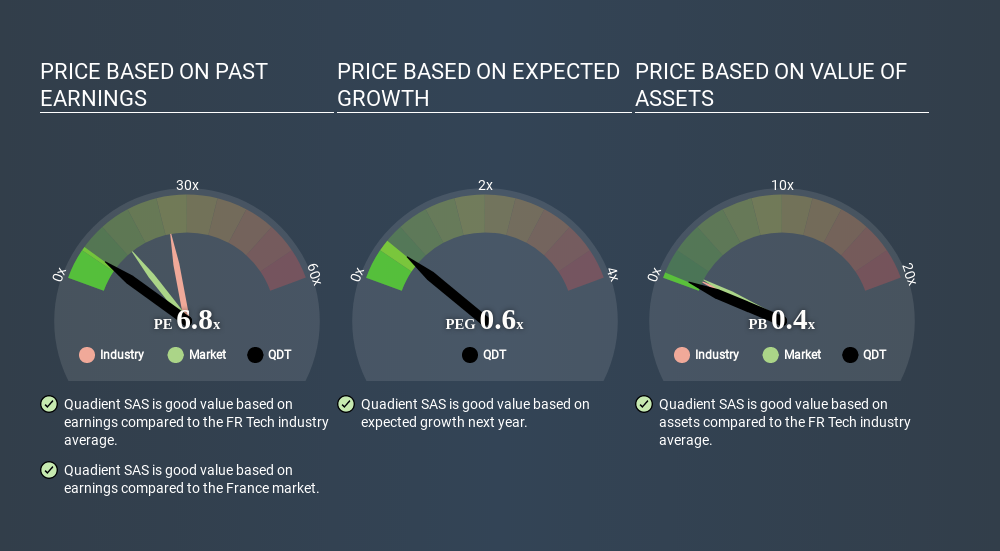
This suggests that market participants think Quadient SAS will underperform other companies in its industry. While current expectations are low, the stock could be undervalued if the situation is better than the market assumes. If you consider the stock interesting, further research is recommended. For example, I often monitor director buying and selling.
How Growth Rates Impact P/E Ratios
When earnings fall, the 'E' decreases, over time. That means even if the current P/E is low, it will increase over time if the share price stays flat. Then, a higher P/E might scare off shareholders, pushing the share price down.
Quadient SAS saw earnings per share decrease by 48% last year. And over the longer term (5 years) earnings per share have decreased 15% annually. This might lead to muted expectations.
Remember: P/E Ratios Don't Consider The Balance Sheet
Don't forget that the P/E ratio considers market capitalization. In other words, it does not consider any debt or cash that the company may have on the balance sheet. The exact same company would hypothetically deserve a higher P/E ratio if it had a strong balance sheet, than if it had a weak one with lots of debt, because a cashed up company can spend on growth.
Spending on growth might be good or bad a few years later, but the point is that the P/E ratio does not account for the option (or lack thereof).
So What Does Quadient SAS's Balance Sheet Tell Us?
Quadient SAS's net debt is considerable, at 134% of its market cap. If you want to compare its P/E ratio to other companies, you must keep in mind that these debt levels would usually warrant a relatively low P/E.
The Bottom Line On Quadient SAS's P/E Ratio
Quadient SAS's P/E is 6.8 which is below average (13.5) in the FR market. The P/E reflects market pessimism that probably arises from the lack of recent EPS growth, paired with significant leverage. Given Quadient SAS's P/E ratio has declined from 10.5 to 6.8 in the last month, we know for sure that the market is more worried about the business today, than it was back then. For those who prefer invest in growth, this stock apparently offers limited promise, but the deep value investors may find the pessimism around this stock enticing.
When the market is wrong about a stock, it gives savvy investors an opportunity. If the reality for a company is not as bad as the P/E ratio indicates, then the share price should increase as the market realizes this. So this free report on the analyst consensus forecasts could help you make a master move on this stock.
Of course you might be able to find a better stock than Quadient SAS. So you may wish to see this free collection of other companies that have grown earnings strongly.
If you spot an error that warrants correction, please contact the editor at editorial-team@simplywallst.com. This article by Simply Wall St is general in nature. It does not constitute a recommendation to buy or sell any stock, and does not take account of your objectives, or your financial situation. Simply Wall St has no position in the stocks mentioned.
We aim to bring you long-term focused research analysis driven by fundamental data. Note that our analysis may not factor in the latest price-sensitive company announcements or qualitative material. Thank you for reading.
About ENXTPA:QDT
Quadient
Provides digital, mail, and lockers for customers through digital and physical channels in North America, France, Benelux, the United Kingdom, Ireland and Germany, Austria, Italy, Switzerland, and internationally.
Undervalued with mediocre balance sheet.
Similar Companies
Market Insights

Weekly Picks

Early mover in a fast growing industry. Likely to experience share price volatility as they scale


A case for CA$31.80 (undiluted), aka 8,616% upside from CA$0.37 (an 86 bagger!).


Moderation and Stabilisation: HOLD: Fair Price based on a 4-year Cycle is $12.08
Recently Updated Narratives


An amazing opportunity to potentially get a 100 bagger

Amazon: Why the World’s Biggest Platform Still Runs on Invisible Economics

Sunrun Stock: When the Energy Transition Collides With the Cost of Capital
Popular Narratives


MicroVision will explode future revenue by 380.37% with a vision towards success


Crazy Undervalued 42 Baggers Silver Play (Active & Running Mine)

