- France
- /
- Semiconductors
- /
- ENXTPA:STMPA
We Think STMicroelectronics (EPA:STMPA) Can Stay On Top Of Its Debt


Legendary fund manager Li Lu (who Charlie Munger backed) once said, 'The biggest investment risk is not the volatility of prices, but whether you will suffer a permanent loss of capital.' So it might be obvious that you need to consider debt, when you think about how risky any given stock is, because too much debt can sink a company. We can see that STMicroelectronics N.V. (EPA:STMPA) does use debt in its business. But is this debt a concern to shareholders?
When Is Debt Dangerous?
Generally speaking, debt only becomes a real problem when a company can't easily pay it off, either by raising capital or with its own cash flow. If things get really bad, the lenders can take control of the business. While that is not too common, we often do see indebted companies permanently diluting shareholders because lenders force them to raise capital at a distressed price. Of course, plenty of companies use debt to fund growth, without any negative consequences. When we think about a company's use of debt, we first look at cash and debt together.
Check out our latest analysis for STMicroelectronics
How Much Debt Does STMicroelectronics Carry?
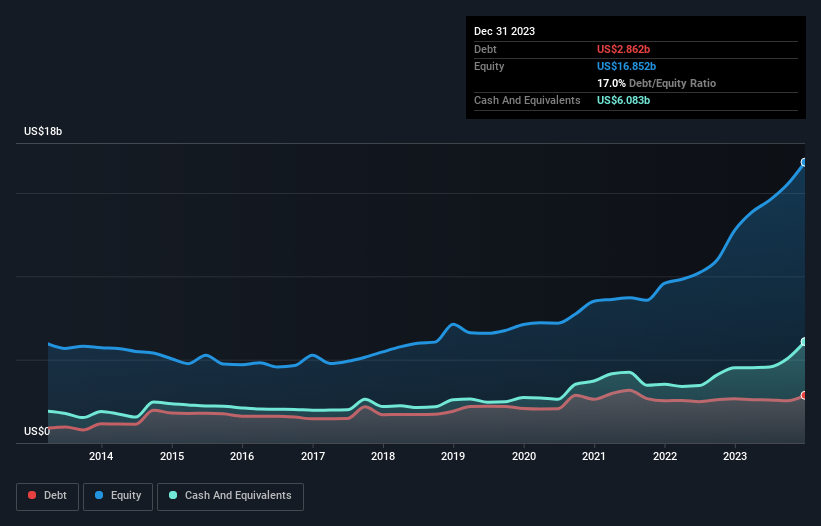
The image below, which you can click on for greater detail, shows that at December 2023 STMicroelectronics had debt of US$2.86b, up from US$2.66b in one year. However, its balance sheet shows it holds US$6.08b in cash, so it actually has US$3.22b net cash.
A Look At STMicroelectronics' Liabilities
The latest balance sheet data shows that STMicroelectronics had liabilities of US$3.73b due within a year, and liabilities of US$3.87b falling due after that. Offsetting this, it had US$6.08b in cash and US$2.66b in receivables that were due within 12 months. So it can boast US$1.14b more liquid assets than total liabilities.
This short term liquidity is a sign that STMicroelectronics could probably pay off its debt with ease, as its balance sheet is far from stretched. Succinctly put, STMicroelectronics boasts net cash, so it's fair to say it does not have a heavy debt load!
The good news is that STMicroelectronics has increased its EBIT by 3.5% over twelve months, which should ease any concerns about debt repayment. There's no doubt that we learn most about debt from the balance sheet. But it is future earnings, more than anything, that will determine STMicroelectronics's ability to maintain a healthy balance sheet going forward. So if you're focused on the future you can check out this free report showing analyst profit forecasts.
Finally, a business needs free cash flow to pay off debt; accounting profits just don't cut it. While STMicroelectronics has net cash on its balance sheet, it's still worth taking a look at its ability to convert earnings before interest and tax (EBIT) to free cash flow, to help us understand how quickly it is building (or eroding) that cash balance. In the last three years, STMicroelectronics's free cash flow amounted to 36% of its EBIT, less than we'd expect. That's not great, when it comes to paying down debt.
Summing Up
While it is always sensible to investigate a company's debt, in this case STMicroelectronics has US$3.22b in net cash and a decent-looking balance sheet. And it also grew its EBIT by 3.5% over the last year. So we don't have any problem with STMicroelectronics's use of debt. The balance sheet is clearly the area to focus on when you are analysing debt. But ultimately, every company can contain risks that exist outside of the balance sheet. For example, we've discovered 1 warning sign for STMicroelectronics that you should be aware of before investing here.
At the end of the day, it's often better to focus on companies that are free from net debt. You can access our special list of such companies (all with a track record of profit growth). It's free.
New: Manage All Your Stock Portfolios in One Place
We've created the ultimate portfolio companion for stock investors, and it's free.
• Connect an unlimited number of Portfolios and see your total in one currency
• Be alerted to new Warning Signs or Risks via email or mobile
• Track the Fair Value of your stocks
Have feedback on this article? Concerned about the content? Get in touch with us directly. Alternatively, email editorial-team (at) simplywallst.com.
This article by Simply Wall St is general in nature. We provide commentary based on historical data and analyst forecasts only using an unbiased methodology and our articles are not intended to be financial advice. It does not constitute a recommendation to buy or sell any stock, and does not take account of your objectives, or your financial situation. We aim to bring you long-term focused analysis driven by fundamental data. Note that our analysis may not factor in the latest price-sensitive company announcements or qualitative material. Simply Wall St has no position in any stocks mentioned.
About ENXTPA:STMPA
STMicroelectronics
Designs, develops, manufactures, and sells semiconductor products in Europe, the Middle East, Africa, the Americas, and the Asia Pacific.
Flawless balance sheet and good value.
Similar Companies
Market Insights

Community Narratives

