Advertisement
Does Sanofi’s Recent 9.6% Rally Signal a Real Change in 2025 Valuation?

Simply Wall St
Reviewed by Bailey Pemberton
If you are holding Sanofi stock or considering adding it to your portfolio, you are hardly alone in weighing your options right now. After a patchy start to the year, Sanofi’s share price has been clawing its way back, jumping 9.6% just in the past week and 7.9% for the month. This uptick follows a period of deep negative sentiment, with the stock still down 9.1% for the year to date and 11.2% over the last twelve months. Yet look further back and those long-term holders have actually seen a return of 20.8% over both three and five years, even with all the recent bumps.
Much of this recent momentum can be traced to a brighter market mood around large pharmaceutical names. Investors are beginning to look beyond earlier concerns and reassess the risks, especially as the sector draws attention for its potential stability amid economic shifts. Sanofi, with its global reach and diverse pipeline, seems to be catching some of that renewed optimism.
When it comes to valuation, here is where Sanofi really stands out. By our standard score, where a maximum of 6 means the company is undervalued on every checklist, the score is a perfect 6. That means every major metric we use to judge value signals that Sanofi could be trading at a bargain, at least when you consider the fundamentals.
But what exactly goes into this score, and does a high number truly mean the stock is undervalued in all the ways that matter? Let’s break down the classic valuation approaches next, and later, get to why a smarter, more holistic view may give investors even more insight.
Why Sanofi is lagging behind its peers
Approach 1: Sanofi Discounted Cash Flow (DCF) Analysis
The Discounted Cash Flow (DCF) model estimates the intrinsic value of a company by projecting its future cash flows and discounting them back to today's value. This technique gives investors a sense of what the company's shares might be worth if its anticipated cash generation were to play out over time.
Sanofi's current Free Cash Flow stands at approximately €8.2 billion. Looking ahead, analysts forecast annual cash flows growing steadily, with estimates reaching €9.4 billion by 2029. In addition to these analyst projections, further years are extrapolated, providing a picture of Sanofi's future potential. Over the next decade, Simply Wall St's DCF model suggests continued, albeit moderate, growth in Free Cash Flow. All figures remain in euros, Sanofi's reporting currency.
After evaluating the numbers using the 2 Stage Free Cash Flow to Equity method, the model calculates a fair value for Sanofi of €179.63 per share. This result indicates the stock is trading at a 52.2% discount to its intrinsic value, which, according to the model, signals that Sanofi may be significantly undervalued in the market today.
Result: UNDERVALUED
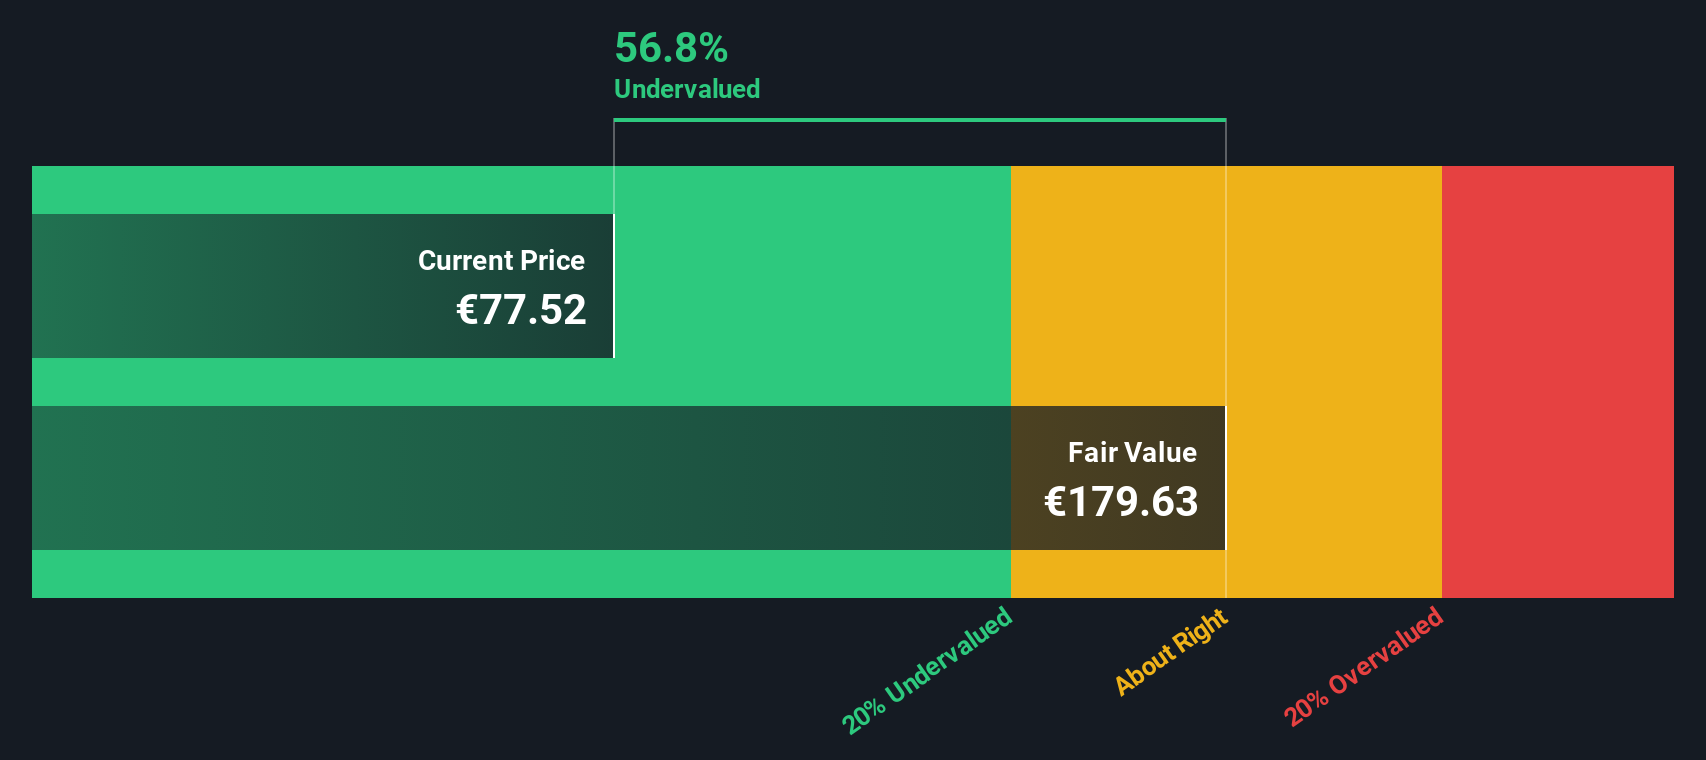
Our Discounted Cash Flow (DCF) analysis suggests Sanofi is undervalued by 52.2%. Track this in your watchlist or portfolio, or discover more undervalued stocks.
Approach 2: Sanofi Price vs Earnings
The Price-to-Earnings (PE) ratio is a widely used valuation tool for profitable companies like Sanofi, as it compares a company’s current share price to its per-share earnings. The PE ratio provides a quick way to gauge how much investors are willing to pay today for a euro of the company’s earnings. Naturally, higher growth expectations and lower perceived risk can justify a higher "normal" or "fair" PE, while more uncertainty or slower growth often result in a lower ratio being considered reasonable.
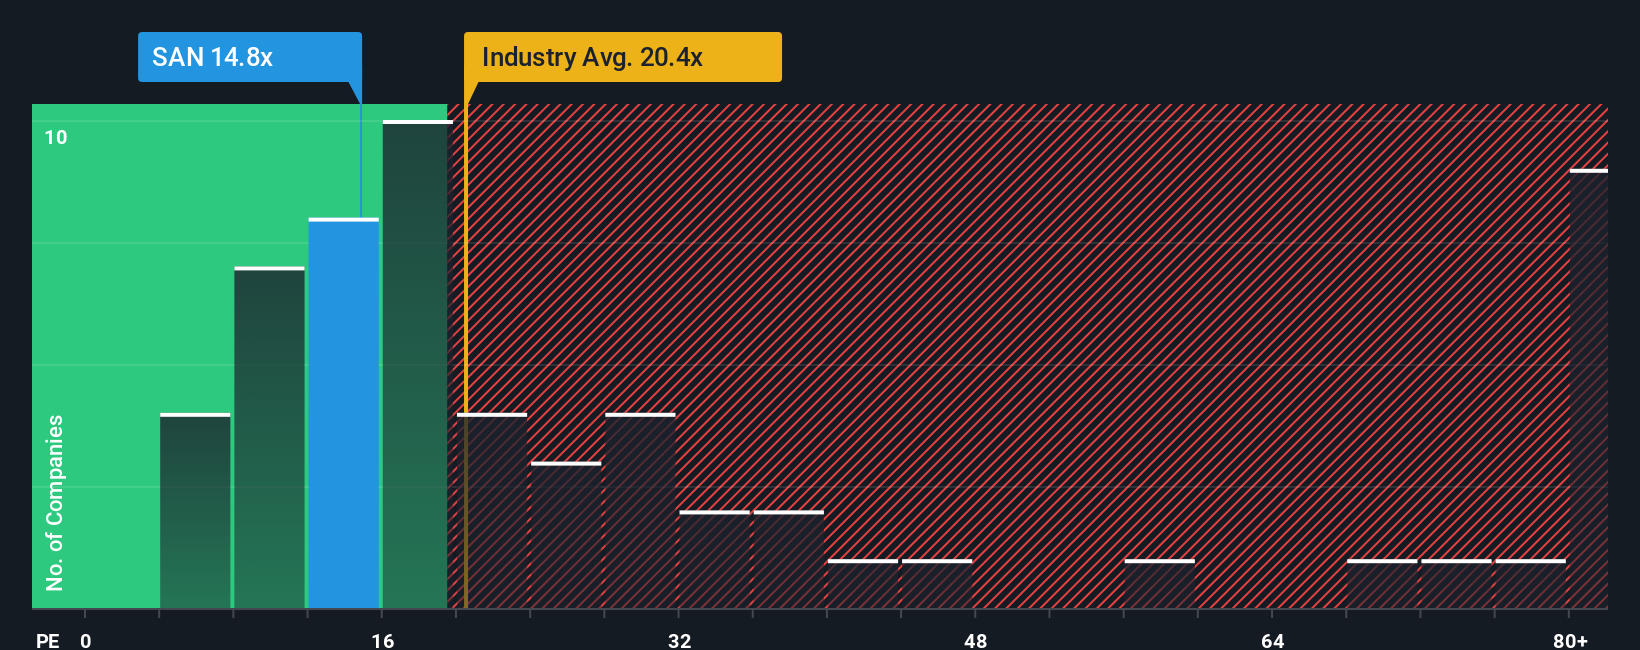
Sanofi is currently trading at a PE ratio of 16.35x. In comparison, the broader pharmaceuticals industry averages a PE of 24.62x, while Sanofi’s peers have an average of 20.27x. On this surface-level view, Sanofi appears to be priced quite conservatively by the market.
However, the "Fair Ratio," which is Simply Wall St’s proprietary PE benchmark, comes in at 21.78x for Sanofi. This Fair Ratio incorporates important factors unique to the business, including expected earnings growth, profit margins, business risks, industry dynamics, and Sanofi’s market capitalization. Unlike just looking at peers or broad industry figures, the Fair Ratio adjusts for these specifics to offer a tailored baseline for what would be a reasonable PE multiple for Sanofi at this stage.
Comparing Sanofi’s actual PE to its Fair Ratio, the current valuation looks meaningfully below where it should be. This suggests the stock is undervalued on this metric.
Result: UNDERVALUED
PE ratios tell one story, but what if the real opportunity lies elsewhere? Discover companies where insiders are betting big on explosive growth.
Upgrade Your Decision Making: Choose your Sanofi Narrative
Earlier we mentioned that there is an even better way to understand valuation, so let's introduce you to Narratives. Narratives are an intuitive tool that lets you attach your story or perspective to Sanofi by setting your own fair value and estimates for the company’s future revenue, earnings, and profit margins. Instead of just crunching the numbers, Narratives directly tie Sanofi’s business story to a forecast and produce a fair value, making the reasoning behind any price target transparent and personal.
On Simply Wall St’s Community page, millions of investors use Narratives to organize their thinking, track how stories evolve, and quickly see how changing news, updated forecasts, or fresh earnings reports impact their view and valuation. Narratives make it easy to know whether to buy, hold, or sell by comparing your estimated fair value to today’s price. This helps you act with confidence when the facts change.
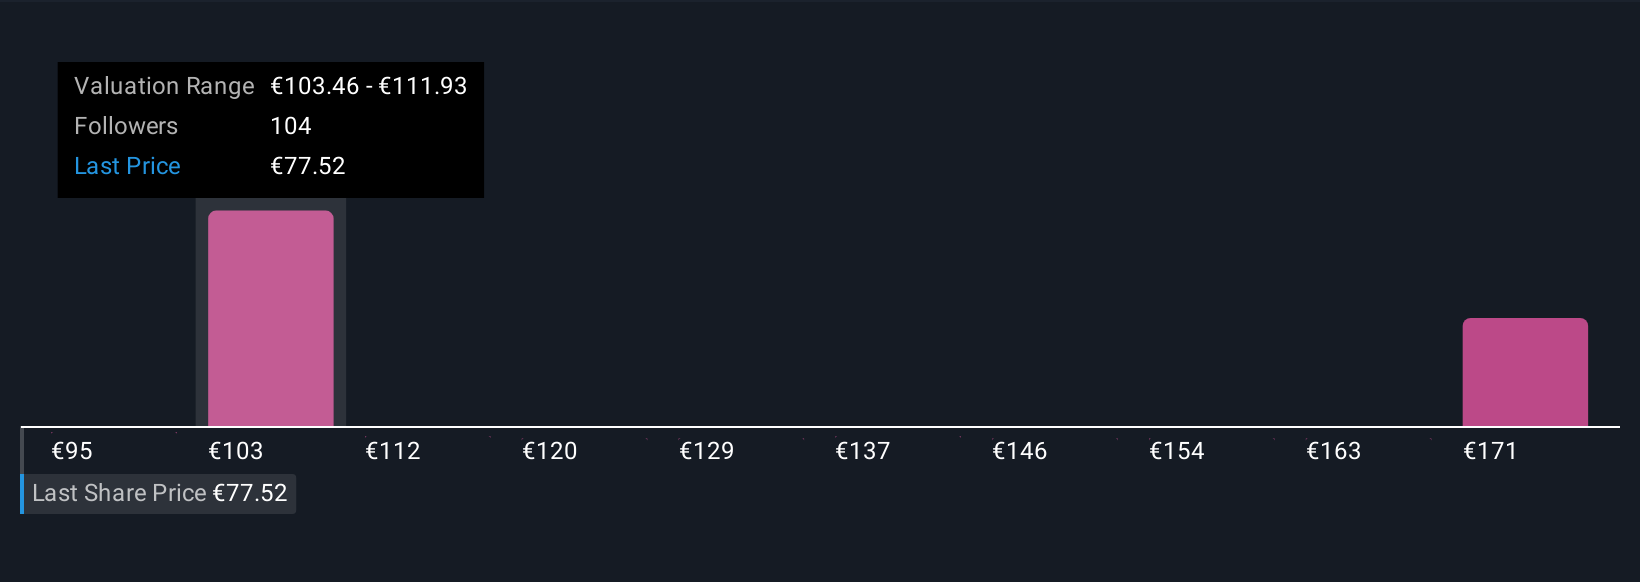
For example, one investor might believe Sanofi’s pipeline and global expansion efforts will drive future earnings over €9.6 billion by 2028 and see a fair value above €124.8, while another, more cautious, may set assumptions that support a fair value closer to €92.0. Narratives reveal and update these differences instantly as the latest facts come in, keeping your investment thinking clear, dynamic, and grounded in both numbers and story.
Do you think there's more to the story for Sanofi? Create your own Narrative to let the Community know!
This article by Simply Wall St is general in nature. We provide commentary based on historical data and analyst forecasts only using an unbiased methodology and our articles are not intended to be financial advice. It does not constitute a recommendation to buy or sell any stock, and does not take account of your objectives, or your financial situation. We aim to bring you long-term focused analysis driven by fundamental data. Note that our analysis may not factor in the latest price-sensitive company announcements or qualitative material. Simply Wall St has no position in any stocks mentioned.
New: Manage All Your Stock Portfolios in One Place
We've created the ultimate portfolio companion for stock investors, and it's free.
• Connect an unlimited number of Portfolios and see your total in one currency
• Be alerted to new Warning Signs or Risks via email or mobile
• Track the Fair Value of your stocks
Have feedback on this article? Concerned about the content? Get in touch with us directly. Alternatively, email editorial-team@simplywallst.com
About ENXTPA:SAN
Sanofi
Engages in the research, development, manufacture, and marketing of therapeutic solutions.
Very undervalued with flawless balance sheet and pays a dividend.
Similar Companies
Market Insights

Advertisement
Community Narratives
The Next Phase of Energy Storage: How NeoVolta Is Tackling America’s Power Crunch
Fair Value US$7.50|30.4% undervalued
MA
Community Contributor
A formidable player in AI and enterprise computing.
Fair Value US$210.00|3.0% undervalued
CO
Community Contributor
IREN's Bold Moves in Sustainable Bitcoin Mining & AI Data Centers
Fair Value US$72.52|20.4% undervalued
BL
Community Contributor
Cooling the Champions: The Aussie Tech Behind F1's Victories
Fair Value AU$12.40|38.1% undervalued
TR
Community Contributor