Advertisement
What Do Ipsen’s Latest Pipeline Updates Mean for Its Share Price in 2025?

Simply Wall St
Reviewed by Bailey Pemberton
Thinking about what to do with Ipsen stock right now? You are far from alone. After all, Ipsen’s recent moves have left both cautious investors and long-term holders watching closely. Shares have nudged up 2.9% in the past week, even after a slight 2.8% dip over the last month. Year to date, the stock is showing a 3.2% gain, and if you look back over the last three and five years, the growth is even more apparent, with returns of 20.8% and a remarkable 50.8%, respectively. That long-term climb hints at a business many believe still has strong potential, even when near-term news does not always grab headlines or move the needle dramatically.
Despite those impressive numbers, the big question is whether the stock’s current price actually reflects its underlying value. If you are wondering how Ipsen stacks up on the valuation front, here is a quick spoiler: it scores a 2 out of 6 on our undervaluation checks. It passes the “cheapness test” on a couple of metrics, but not quite enough to claim deep value status just yet.
Now, let’s dig into what those valuation approaches actually say about Ipsen today. For those looking to go beyond the numbers, stay tuned for a smart perspective on true valuation that many investors miss.
Ipsen scores just 2/6 on our valuation checks. See what other red flags we found in the full valuation breakdown.
Approach 1: Ipsen Discounted Cash Flow (DCF) Analysis
The Discounted Cash Flow (DCF) approach estimates a company’s value by projecting its future cash flows and discounting them back to today’s terms. This model essentially looks ahead and asks what Ipsen’s future earnings are worth right now if you factor in time and risk.
Currently, Ipsen generates Free Cash Flow of €516.8 million. Analyst forecasts estimate cash flow will reach €768 million by 2029, with projections over the next decade showing a steady path upwards. While analysts directly estimate up to 2029, longer-term numbers are based on a careful extrapolation of trends. These projections provide a robust basis for evaluating whether the stock is offering good value today.
According to the 2 Stage Free Cash Flow to Equity model, the intrinsic value per share comes out to €205.31. This implies that Ipsen stock is trading at a significant 43.2% discount to its estimated value. In other words, the current share price is well below what these cash flow projections suggest it should be.
Result: UNDERVALUED
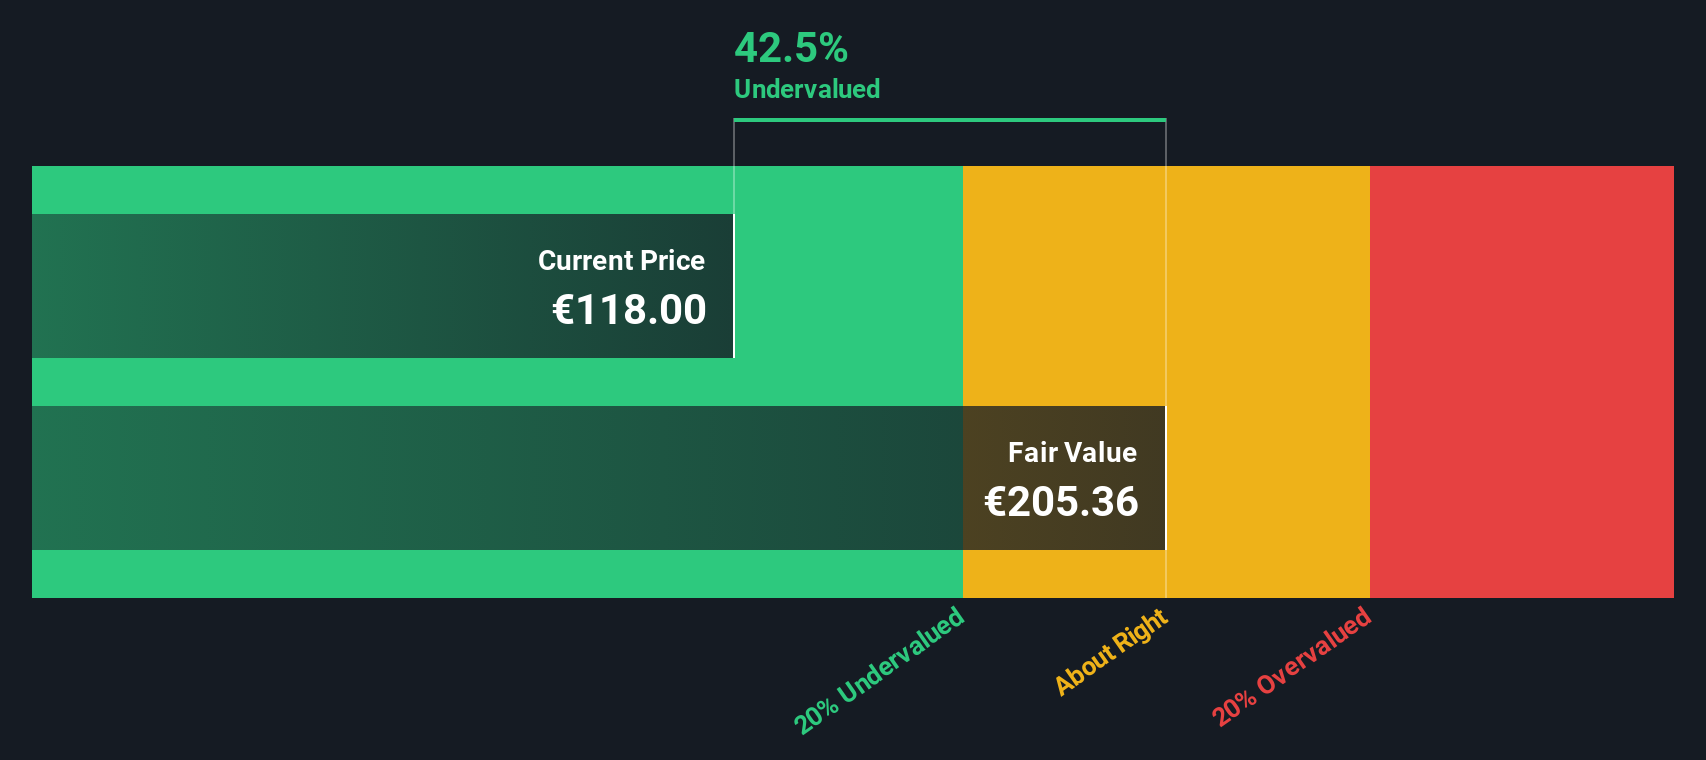
Our Discounted Cash Flow (DCF) analysis suggests Ipsen is undervalued by 43.2%. Track this in your watchlist or portfolio, or discover more undervalued stocks.
Approach 2: Ipsen Price vs Earnings
The Price-to-Earnings (PE) ratio is one of the most popular valuation metrics for profitable companies like Ipsen, since it directly connects the price investors pay with the actual earnings the business generates. For companies that post healthy profits, the PE ratio is a quick way to gauge whether the market price is high or low in relation to those earnings.
The “right” PE ratio for a stock depends on how quickly the business is expected to grow and how much risk is associated with its future. Higher growth companies tend to trade at higher PE ratios. Any perceived risks, such as industry headwinds or unpredictable earnings, usually push that number lower. A stock’s PE should be viewed in the context of other companies in the same industry and among its direct peers.
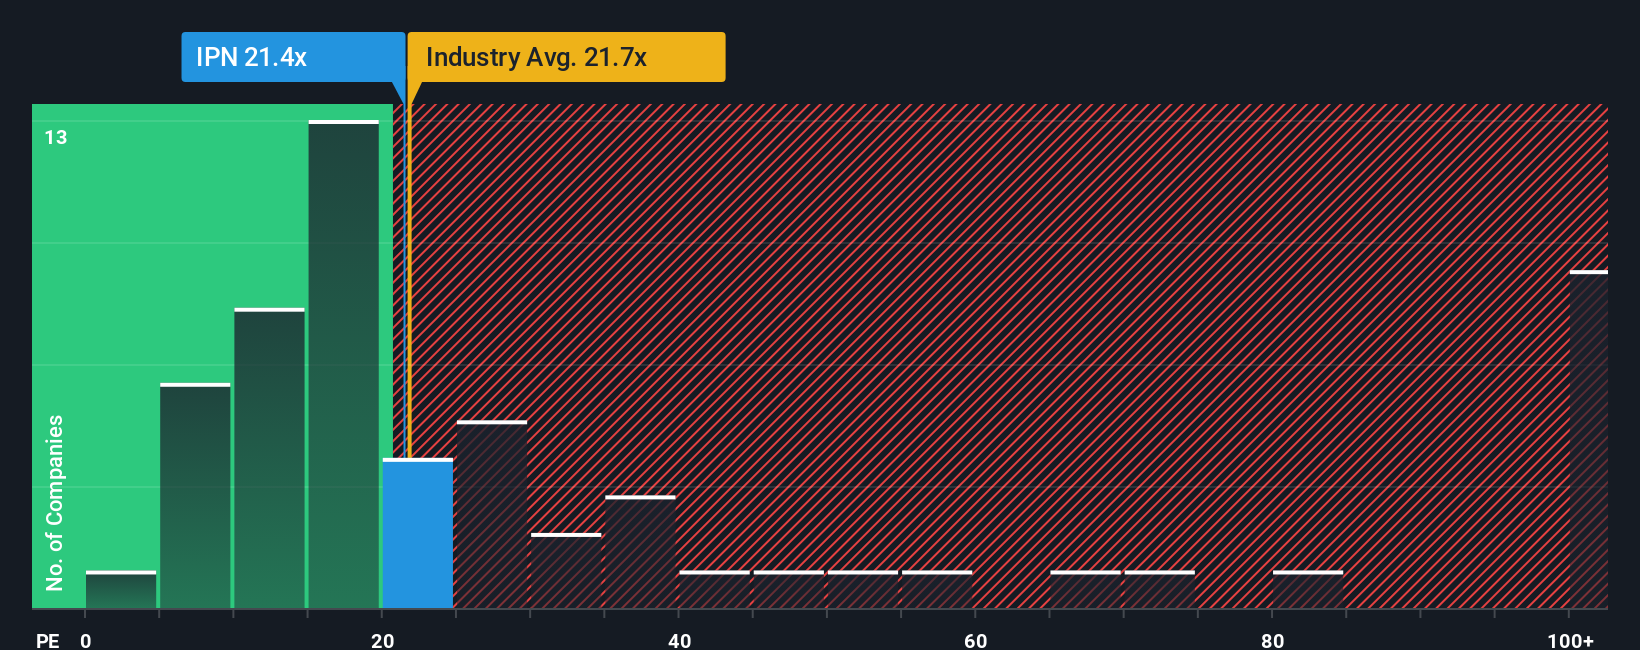
Currently, Ipsen trades at a PE ratio of 21.4x. That is below the pharmaceuticals industry average of 24.7x, but above its peer average at 19.0x. Simply Wall St’s Fair Ratio for Ipsen is 16.6x, which factors in Ipsen’s growth potential, risks, margins, market cap, and industry dynamics. The Fair Ratio is much more tailored than simply comparing with peers or the broader sector, since it adjusts for what makes Ipsen unique rather than grouping it in with every other pharmaceutical company.
Because Ipsen’s actual PE of 21.4x is significantly above its Fair Ratio of 16.6x, the stock appears overvalued by this measure.
Result: OVERVALUED
PE ratios tell one story, but what if the real opportunity lies elsewhere? Discover companies where insiders are betting big on explosive growth.
Upgrade Your Decision Making: Choose your Ipsen Narrative
Earlier, we mentioned that there is an even better way to understand valuation, so let’s introduce you to Narratives. A Narrative is a clear, customizable story of your perspective on Ipsen's future, linking your assumptions about growth and profit margins to a unique financial forecast and fair value. Essentially, it is the “why” and “how” behind the numbers.
This approach brings investing to life by letting you craft or follow a Narrative within the Simply Wall St Community, where millions of investors do the same, making it both accessible and engaging. Your Narrative is dynamic, as it stays up to date when fresh information, like earnings announcements or major news, emerges, so you are never left behind in your research.
Narratives help you decide when to act by comparing your Fair Value estimate to the current share price, showing whether the stock fits your story of Ipsen’s potential. For example, some investors see Ipsen’s expanding specialty pipeline and international approvals leading to robust growth and have higher fair values, while others caution that heavy reliance on a few drugs and looming patent expiries warrant a lower target. Your Narrative reflects your outlook and risk comfort in a clear, quantitative way.
Do you think there's more to the story for Ipsen? Create your own Narrative to let the Community know!
This article by Simply Wall St is general in nature. We provide commentary based on historical data and analyst forecasts only using an unbiased methodology and our articles are not intended to be financial advice. It does not constitute a recommendation to buy or sell any stock, and does not take account of your objectives, or your financial situation. We aim to bring you long-term focused analysis driven by fundamental data. Note that our analysis may not factor in the latest price-sensitive company announcements or qualitative material. Simply Wall St has no position in any stocks mentioned.
New: AI Stock Screener & Alerts
Our new AI Stock Screener scans the market every day to uncover opportunities.
• Dividend Powerhouses (3%+ Yield)
• Undervalued Small Caps with Insider Buying
• High growth Tech and AI Companies
Or build your own from over 50 metrics.
Have feedback on this article? Concerned about the content? Get in touch with us directly. Alternatively, email editorial-team@simplywallst.com
About ENXTPA:IPN
Flawless balance sheet average dividend payer.
Similar Companies
Market Insights

Advertisement
Community Narratives
The Next Phase of Energy Storage: How NeoVolta Is Tackling America’s Power Crunch
Fair Value US$7.50|35.1% undervalued
MA
Community Contributor
Why EnSilica is Worth Possibly 13x its Current Price
Fair Value UK£5.00|89.5% undervalued
DO
Community Contributor
M&A Activity, Industry Diversification & A Defense Contract Monopoly Will Push BWXT For Healthy Long-Term Growth
Fair Value US$220.00|15.2% undervalued
CL
Community Contributor
A case for Cassiar Gold Corp (TSXV: GLDC) to reach CAD$8-10 before 2030 (X30-37)
Fair Value CA$10.00|96.0% undervalued
AG
Community Contributor