Why Investors Shouldn't Be Surprised By METabolic EXplorer S.A.'s (EPA:METEX) 27% Share Price Plunge
To the annoyance of some shareholders, METabolic EXplorer S.A. (EPA:METEX) shares are down a considerable 27% in the last month, which continues a horrid run for the company. The recent drop completes a disastrous twelve months for shareholders, who are sitting on a 78% loss during that time.
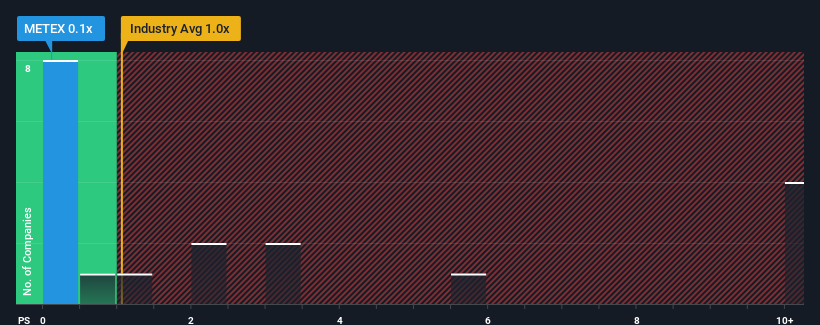
Since its price has dipped substantially, METabolic EXplorer may be sending bullish signals at the moment with its price-to-sales (or "P/S") ratio of 0.1x, since almost half of all companies in the Chemicals industry in France have P/S ratios greater than 1x and even P/S higher than 5x are not unusual. Although, it's not wise to just take the P/S at face value as there may be an explanation why it's limited.
View our latest analysis for METabolic EXplorer

How METabolic EXplorer Has Been Performing
METabolic EXplorer could be doing better as its revenue has been going backwards lately while most other companies have been seeing positive revenue growth. The P/S ratio is probably low because investors think this poor revenue performance isn't going to get any better. So while you could say the stock is cheap, investors will be looking for improvement before they see it as good value.
Keen to find out how analysts think METabolic EXplorer's future stacks up against the industry? In that case, our free report is a great place to start.How Is METabolic EXplorer's Revenue Growth Trending?
In order to justify its P/S ratio, METabolic EXplorer would need to produce sluggish growth that's trailing the industry.
Taking a look back first, the company's revenue growth last year wasn't something to get excited about as it posted a disappointing decline of 36%. In spite of this, the company still managed to deliver immense revenue growth over the last three years. So while the company has done a great job in the past, it's somewhat concerning to see revenue growth decline so harshly.
Turning to the outlook, the next year should generate growth of 7.6% as estimated by the sole analyst watching the company. That's shaping up to be materially lower than the 40% growth forecast for the broader industry.
With this information, we can see why METabolic EXplorer is trading at a P/S lower than the industry. It seems most investors are expecting to see limited future growth and are only willing to pay a reduced amount for the stock.
The Bottom Line On METabolic EXplorer's P/S
METabolic EXplorer's recently weak share price has pulled its P/S back below other Chemicals companies. Generally, our preference is to limit the use of the price-to-sales ratio to establishing what the market thinks about the overall health of a company.
We've established that METabolic EXplorer maintains its low P/S on the weakness of its forecast growth being lower than the wider industry, as expected. At this stage investors feel the potential for an improvement in revenue isn't great enough to justify a higher P/S ratio. Unless these conditions improve, they will continue to form a barrier for the share price around these levels.
We don't want to rain on the parade too much, but we did also find 5 warning signs for METabolic EXplorer (1 shouldn't be ignored!) that you need to be mindful of.
Of course, profitable companies with a history of great earnings growth are generally safer bets. So you may wish to see this free collection of other companies that have reasonable P/E ratios and have grown earnings strongly.
New: Manage All Your Stock Portfolios in One Place
We've created the ultimate portfolio companion for stock investors, and it's free.
• Connect an unlimited number of Portfolios and see your total in one currency
• Be alerted to new Warning Signs or Risks via email or mobile
• Track the Fair Value of your stocks
Have feedback on this article? Concerned about the content? Get in touch with us directly. Alternatively, email editorial-team (at) simplywallst.com.
This article by Simply Wall St is general in nature. We provide commentary based on historical data and analyst forecasts only using an unbiased methodology and our articles are not intended to be financial advice. It does not constitute a recommendation to buy or sell any stock, and does not take account of your objectives, or your financial situation. We aim to bring you long-term focused analysis driven by fundamental data. Note that our analysis may not factor in the latest price-sensitive company announcements or qualitative material. Simply Wall St has no position in any stocks mentioned.
About ENXTPA:METEX
METabolic EXplorer
A biological chemistry company, engages in the development and industrialization of industrial fermentation processes as alternatives to petrochemical processes worldwide.
Low and slightly overvalued.
Similar Companies
Market Insights
Weekly Picks

THE KINGDOM OF BROWN GOODS: WHY MGPI IS BEING CRUSHED BY INVENTORY & PRIMED FOR RESURRECTION


Why Vertical Aerospace (NYSE: EVTL) is Worth Possibly Over 13x its Current Price


The Quiet Giant That Became AI’s Power Grid
Recently Updated Narratives

Growing between 25-50% for the next 3-5 years

SLI is share to watch next 5 years


The "Molecular Pencil": Why Beam's Technology is Built to Win
Popular Narratives


MicroVision will explode future revenue by 380.37% with a vision towards success


NVDA: Expanding AI Demand Will Drive Major Data Center Investments Through 2026


