Stock Analysis
- France
- /
- Paper and Forestry Products
- /
- ENXTPA:ALMOU
Moulinvest's (EPA:ALMOU) five-year total shareholder returns outpace the underlying earnings growth


It might be of some concern to shareholders to see the Moulinvest S.A. (EPA:ALMOU) share price down 17% in the last month. But that doesn't undermine the fantastic longer term performance (measured over five years). In fact, during that period, the share price climbed 327%. Impressive! So it might be that some shareholders are taking profits after good performance. But the real question is whether the business fundamentals can improve over the long term. While the long term returns are impressive, we do have some sympathy for those who bought more recently, given the 26% drop, in the last year.
Since the long term performance has been good but there's been a recent pullback of 15%, let's check if the fundamentals match the share price.
View our latest analysis for Moulinvest
While markets are a powerful pricing mechanism, share prices reflect investor sentiment, not just underlying business performance. One way to examine how market sentiment has changed over time is to look at the interaction between a company's share price and its earnings per share (EPS).
Over half a decade, Moulinvest managed to grow its earnings per share at 2.0% a year. This EPS growth is lower than the 34% average annual increase in the share price. So it's fair to assume the market has a higher opinion of the business than it did five years ago. That's not necessarily surprising considering the five-year track record of earnings growth.
The image below shows how EPS has tracked over time (if you click on the image you can see greater detail).
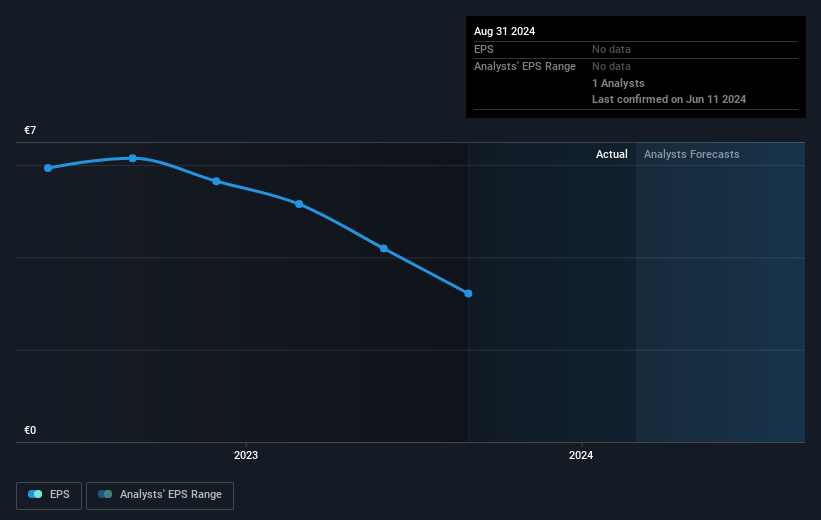
It might be well worthwhile taking a look at our free report on Moulinvest's earnings, revenue and cash flow.
What About Dividends?
As well as measuring the share price return, investors should also consider the total shareholder return (TSR). Whereas the share price return only reflects the change in the share price, the TSR includes the value of dividends (assuming they were reinvested) and the benefit of any discounted capital raising or spin-off. Arguably, the TSR gives a more comprehensive picture of the return generated by a stock. We note that for Moulinvest the TSR over the last 5 years was 354%, which is better than the share price return mentioned above. The dividends paid by the company have thusly boosted the total shareholder return.
A Different Perspective
While the broader market gained around 5.1% in the last year, Moulinvest shareholders lost 24% (even including dividends). However, keep in mind that even the best stocks will sometimes underperform the market over a twelve month period. On the bright side, long term shareholders have made money, with a gain of 35% per year over half a decade. It could be that the recent sell-off is an opportunity, so it may be worth checking the fundamental data for signs of a long term growth trend. While it is well worth considering the different impacts that market conditions can have on the share price, there are other factors that are even more important. For example, we've discovered 4 warning signs for Moulinvest that you should be aware of before investing here.
If you like to buy stocks alongside management, then you might just love this free list of companies. (Hint: many of them are unnoticed AND have attractive valuation).
Please note, the market returns quoted in this article reflect the market weighted average returns of stocks that currently trade on French exchanges.
Valuation is complex, but we're helping make it simple.
Find out whether Moulinvest is potentially over or undervalued by checking out our comprehensive analysis, which includes fair value estimates, risks and warnings, dividends, insider transactions and financial health.
View the Free AnalysisHave feedback on this article? Concerned about the content? Get in touch with us directly. Alternatively, email editorial-team (at) simplywallst.com.
This article by Simply Wall St is general in nature. We provide commentary based on historical data and analyst forecasts only using an unbiased methodology and our articles are not intended to be financial advice. It does not constitute a recommendation to buy or sell any stock, and does not take account of your objectives, or your financial situation. We aim to bring you long-term focused analysis driven by fundamental data. Note that our analysis may not factor in the latest price-sensitive company announcements or qualitative material. Simply Wall St has no position in any stocks mentioned.
About ENXTPA:ALMOU
Excellent balance sheet and good value.
