
Advertisement
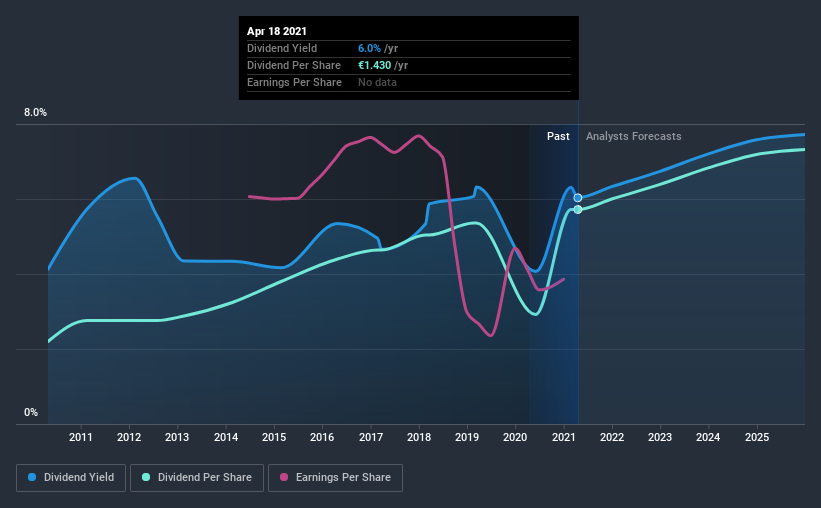
Tread With Caution Around AXA SA's (EPA:CS) 6.0% Dividend Yield

Could AXA SA (EPA:CS) be an attractive dividend share to own for the long haul? Investors are often drawn to strong companies with the idea of reinvesting the dividends. If you are hoping to live on your dividends, it's important to be more stringent with your investments than the average punter. Regular readers know we like to apply the same approach to each dividend stock, and we hope you'll find our analysis useful.
In this case, AXA likely looks attractive to investors, given its 6.0% dividend yield and a payment history of over ten years. We'd guess that plenty of investors have purchased it for the income. Before you buy any stock for its dividend however, you should always remember Warren Buffett's two rules: 1) Don't lose money, and 2) Remember rule #1. We'll run through some checks below to help with this.
Click the interactive chart for our full dividend analysis
Payout ratios
Dividends are typically paid from company earnings. If a company pays more in dividends than it earned, then the dividend might become unsustainable - hardly an ideal situation. Comparing dividend payments to a company's net profit after tax is a simple way of reality-checking whether a dividend is sustainable. In the last year, AXA paid out 114% of its profit as dividends. Unless there are extenuating circumstances, from the perspective of an investor who hopes to own the company for many years, a payout ratio of above 100% is definitely a concern.
Consider getting our latest analysis on AXA's financial position here.
Dividend Volatility
Before buying a stock for its income, we want to see if the dividends have been stable in the past, and if the company has a track record of maintaining its dividend. For the purpose of this article, we only scrutinise the last decade of AXA's dividend payments. The dividend has been cut on at least one occasion historically. During the past 10-year period, the first annual payment was €0.6 in 2011, compared to €1.4 last year. This works out to be a compound annual growth rate (CAGR) of approximately 10% a year over that time. The growth in dividends has not been linear, but the CAGR is a decent approximation of the rate of change over this time frame.
So, its dividends have grown at a rapid rate over this time, but payments have been cut in the past. The stock may still be worth considering as part of a diversified dividend portfolio.
Dividend Growth Potential
Given that the dividend has been cut in the past, we need to check if earnings are growing and if that might lead to stronger dividends in the future. AXA's EPS have fallen by approximately 10% per year during the past five years. A sharp decline in earnings per share is not great from from a dividend perspective, as even conservative payout ratios can come under pressure if earnings fall far enough.
Conclusion
Dividend investors should always want to know if a) a company's dividends are affordable, b) if there is a track record of consistent payments, and c) if the dividend is capable of growing. AXA is paying out a larger percentage of its profit than we're comfortable with. Earnings per share are down, and AXA's dividend has been cut at least once in the past, which is disappointing. Using these criteria, AXA looks suboptimal from a dividend investment perspective.
Companies possessing a stable dividend policy will likely enjoy greater investor interest than those suffering from a more inconsistent approach. Meanwhile, despite the importance of dividend payments, they are not the only factors our readers should know when assessing a company. For instance, we've picked out 2 warning signs for AXA that investors should take into consideration.
Looking for more high-yielding dividend ideas? Try our curated list of dividend stocks with a yield above 3%.
If you decide to trade AXA, use the lowest-cost* platform that is rated #1 Overall by Barron’s, Interactive Brokers. Trade stocks, options, futures, forex, bonds and funds on 135 markets, all from a single integrated account. Promoted
New: Manage All Your Stock Portfolios in One Place
We've created the ultimate portfolio companion for stock investors, and it's free.
• Connect an unlimited number of Portfolios and see your total in one currency
• Be alerted to new Warning Signs or Risks via email or mobile
• Track the Fair Value of your stocks
This article by Simply Wall St is general in nature. It does not constitute a recommendation to buy or sell any stock, and does not take account of your objectives, or your financial situation. We aim to bring you long-term focused analysis driven by fundamental data. Note that our analysis may not factor in the latest price-sensitive company announcements or qualitative material. Simply Wall St has no position in any stocks mentioned.
*Interactive Brokers Rated Lowest Cost Broker by StockBrokers.com Annual Online Review 2020
Have feedback on this article? Concerned about the content? Get in touch with us directly. Alternatively, email editorial-team (at) simplywallst.com.
About ENXTPA:CS
AXA
Through its subsidiaries, insurance, asset management, and banking services worldwide.
Undervalued average dividend payer.
Similar Companies
Market Insights

Advertisement
Community Narratives
Groundbreaking therapies that could change the treatment landscape for PTSD, fibromyalgia, MS & Alzheimer’s
Fair Value US$6.20|86.9% undervalued
CM
Community Contributor
DigitalOcean Will Grow 14% by Embracing AI with Paperspace Acquisition
Fair Value US$50.00|41.7% undervalued
NE
Community Contributor
Viant Technology: A Rising AdTech Challenger in the AI-Powered CTV Market
Fair Value US$38.61|63.2% undervalued
BL
Community Contributor
Volvo will Accelerate Forward into Electric and Autonomous Leadership in Five Years
Fair Value SEK 438.80|39.7% undervalued
UN
Community Contributor