- France
- /
- Personal Products
- /
- ENXTPA:OR
L'Oréal S.A.'s (EPA:OR) Intrinsic Value Is Potentially 25% Below Its Share Price


Key Insights
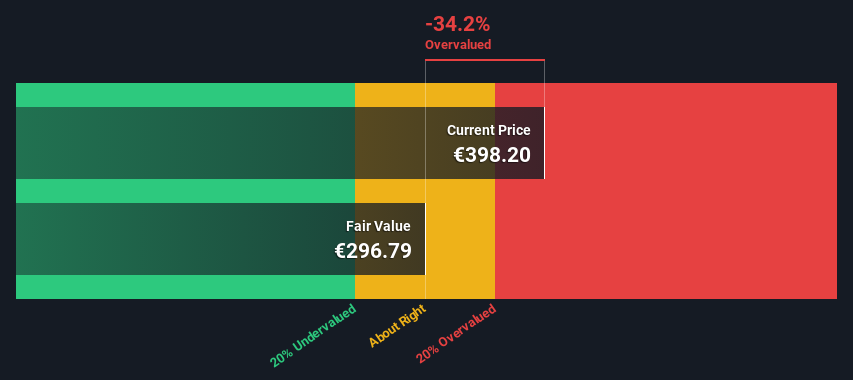
- L'Oréal's estimated fair value is €297 based on 2 Stage Free Cash Flow to Equity
- L'Oréal's €398 share price signals that it might be 34% overvalued
- The €425 analyst price target for OR is 43% more than our estimate of fair value
Today we will run through one way of estimating the intrinsic value of L'Oréal S.A. (EPA:OR) by taking the expected future cash flows and discounting them to their present value. This will be done using the Discounted Cash Flow (DCF) model. Models like these may appear beyond the comprehension of a lay person, but they're fairly easy to follow.
Companies can be valued in a lot of ways, so we would point out that a DCF is not perfect for every situation. If you still have some burning questions about this type of valuation, take a look at the Simply Wall St analysis model.
Check out our latest analysis for L'Oréal
The Method
We are going to use a two-stage DCF model, which, as the name states, takes into account two stages of growth. The first stage is generally a higher growth period which levels off heading towards the terminal value, captured in the second 'steady growth' period. In the first stage we need to estimate the cash flows to the business over the next ten years. Where possible we use analyst estimates, but when these aren't available we extrapolate the previous free cash flow (FCF) from the last estimate or reported value. We assume companies with shrinking free cash flow will slow their rate of shrinkage, and that companies with growing free cash flow will see their growth rate slow, over this period. We do this to reflect that growth tends to slow more in the early years than it does in later years.
A DCF is all about the idea that a dollar in the future is less valuable than a dollar today, so we discount the value of these future cash flows to their estimated value in today's dollars:
10-year free cash flow (FCF) forecast
| 2024 | 2025 | 2026 | 2027 | 2028 | 2029 | 2030 | 2031 | 2032 | 2033 | |
| Levered FCF (€, Millions) | €7.20b | €7.79b | €8.09b | €8.88b | €9.32b | €9.66b | €9.92b | €10.1b | €10.3b | €10.5b |
| Growth Rate Estimate Source | Analyst x12 | Analyst x10 | Analyst x2 | Analyst x2 | Est @ 4.90% | Est @ 3.65% | Est @ 2.78% | Est @ 2.17% | Est @ 1.74% | Est @ 1.44% |
| Present Value (€, Millions) Discounted @ 6.6% | €6.8k | €6.9k | €6.7k | €6.9k | €6.8k | €6.6k | €6.3k | €6.1k | €5.8k | €5.5k |
("Est" = FCF growth rate estimated by Simply Wall St)
Present Value of 10-year Cash Flow (PVCF) = €64b
The second stage is also known as Terminal Value, this is the business's cash flow after the first stage. The Gordon Growth formula is used to calculate Terminal Value at a future annual growth rate equal to the 5-year average of the 10-year government bond yield of 0.7%. We discount the terminal cash flows to today's value at a cost of equity of 6.6%.
Terminal Value (TV)= FCF2033 × (1 + g) ÷ (r – g) = €10b× (1 + 0.7%) ÷ (6.6%– 0.7%) = €180b
Present Value of Terminal Value (PVTV)= TV / (1 + r)10= €180b÷ ( 1 + 6.6%)10= €95b
The total value, or equity value, is then the sum of the present value of the future cash flows, which in this case is €159b. In the final step we divide the equity value by the number of shares outstanding. Compared to the current share price of €398, the company appears reasonably expensive at the time of writing. Valuations are imprecise instruments though, rather like a telescope - move a few degrees and end up in a different galaxy. Do keep this in mind.
The Assumptions
We would point out that the most important inputs to a discounted cash flow are the discount rate and of course the actual cash flows. You don't have to agree with these inputs, I recommend redoing the calculations yourself and playing with them. The DCF also does not consider the possible cyclicality of an industry, or a company's future capital requirements, so it does not give a full picture of a company's potential performance. Given that we are looking at L'Oréal as potential shareholders, the cost of equity is used as the discount rate, rather than the cost of capital (or weighted average cost of capital, WACC) which accounts for debt. In this calculation we've used 6.6%, which is based on a levered beta of 1.020. Beta is a measure of a stock's volatility, compared to the market as a whole. We get our beta from the industry average beta of globally comparable companies, with an imposed limit between 0.8 and 2.0, which is a reasonable range for a stable business.
SWOT Analysis for L'Oréal
- Debt is not viewed as a risk.
- Dividends are covered by earnings and cash flows.
- Earnings growth over the past year underperformed the Personal Products industry.
- Dividend is low compared to the top 25% of dividend payers in the Personal Products market.
- Annual revenue is forecast to grow faster than the French market.
- Good value based on P/E ratio compared to estimated Fair P/E ratio.
- Annual earnings are forecast to grow slower than the French market.
Moving On:
Whilst important, the DCF calculation is only one of many factors that you need to assess for a company. The DCF model is not a perfect stock valuation tool. Rather it should be seen as a guide to "what assumptions need to be true for this stock to be under/overvalued?" For instance, if the terminal value growth rate is adjusted slightly, it can dramatically alter the overall result. Can we work out why the company is trading at a premium to intrinsic value? For L'Oréal, we've put together three additional aspects you should look at:
- Financial Health: Does OR have a healthy balance sheet? Take a look at our free balance sheet analysis with six simple checks on key factors like leverage and risk.
- Future Earnings: How does OR's growth rate compare to its peers and the wider market? Dig deeper into the analyst consensus number for the upcoming years by interacting with our free analyst growth expectation chart.
- Other High Quality Alternatives: Do you like a good all-rounder? Explore our interactive list of high quality stocks to get an idea of what else is out there you may be missing!
PS. The Simply Wall St app conducts a discounted cash flow valuation for every stock on the ENXTPA every day. If you want to find the calculation for other stocks just search here.
If you're looking to trade L'Oréal, open an account with the lowest-cost platform trusted by professionals, Interactive Brokers.
With clients in over 200 countries and territories, and access to 160 markets, IBKR lets you trade stocks, options, futures, forex, bonds and funds from a single integrated account.
Enjoy no hidden fees, no account minimums, and FX conversion rates as low as 0.03%, far better than what most brokers offer.
Sponsored ContentNew: AI Stock Screener & Alerts
Our new AI Stock Screener scans the market every day to uncover opportunities.
• Dividend Powerhouses (3%+ Yield)
• Undervalued Small Caps with Insider Buying
• High growth Tech and AI Companies
Or build your own from over 50 metrics.
Have feedback on this article? Concerned about the content? Get in touch with us directly. Alternatively, email editorial-team (at) simplywallst.com.
This article by Simply Wall St is general in nature. We provide commentary based on historical data and analyst forecasts only using an unbiased methodology and our articles are not intended to be financial advice. It does not constitute a recommendation to buy or sell any stock, and does not take account of your objectives, or your financial situation. We aim to bring you long-term focused analysis driven by fundamental data. Note that our analysis may not factor in the latest price-sensitive company announcements or qualitative material. Simply Wall St has no position in any stocks mentioned.
About ENXTPA:OR
L'Oréal
Through its subsidiaries, manufactures and sells cosmetic products for women and men worldwide.
Excellent balance sheet average dividend payer.
Similar Companies
Market Insights

Community Narratives

