
Advertisement
- France
- /
- Medical Equipment
- /
- ENXTPA:ALBLU
Bluelinea Société Anonyme's (EPA:ALBLU) Shares Leap 27% Yet They're Still Not Telling The Full Story
Bluelinea Société Anonyme (EPA:ALBLU) shareholders would be excited to see that the share price has had a great month, posting a 27% gain and recovering from prior weakness. Not all shareholders will be feeling jubilant, since the share price is still down a very disappointing 31% in the last twelve months.
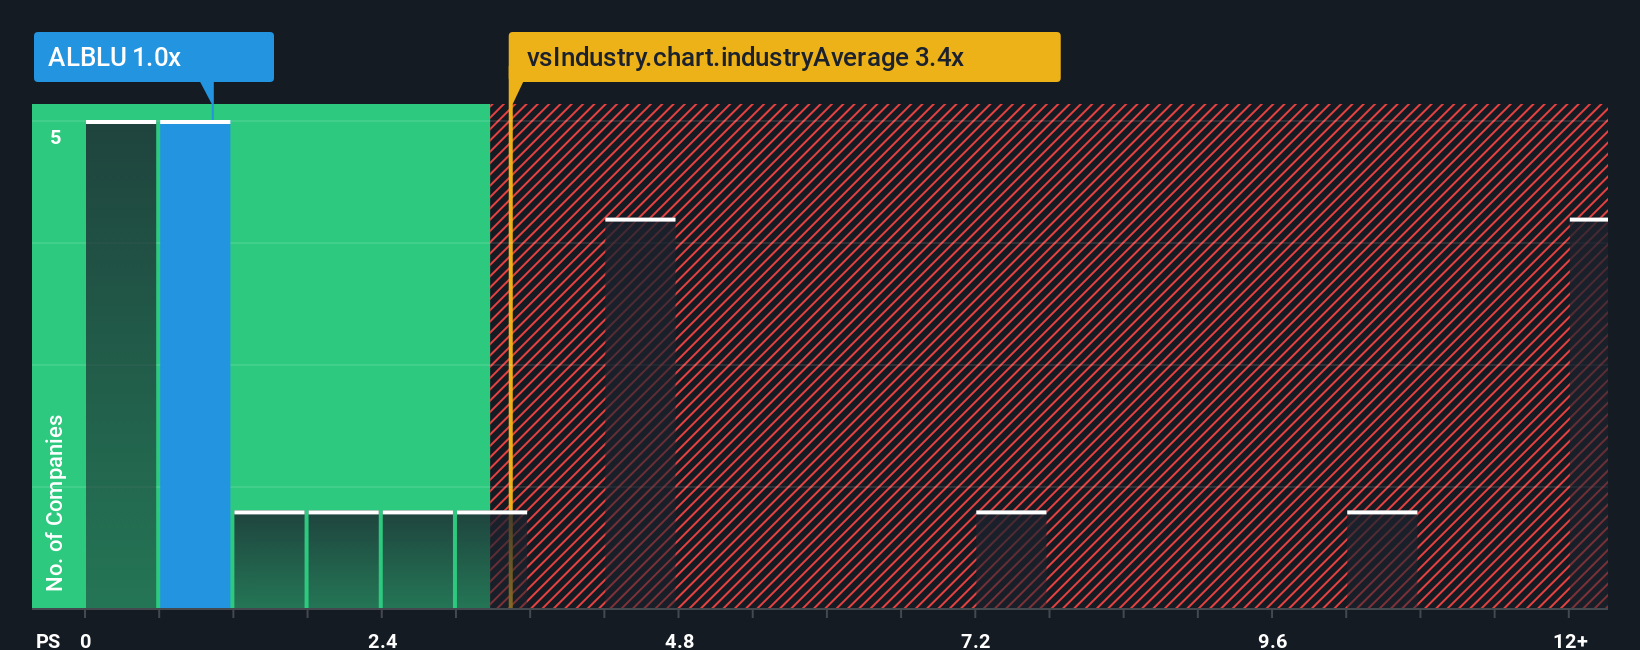
Even after such a large jump in price, Bluelinea Société Anonyme may still be sending buy signals at present with its price-to-sales (or "P/S") ratio of 1x, considering almost half of all companies in the Medical Equipment industry in France have P/S ratios greater than 2.8x and even P/S higher than 5x aren't out of the ordinary. Although, it's not wise to just take the P/S at face value as there may be an explanation why it's limited.
View our latest analysis for Bluelinea Société Anonyme
What Does Bluelinea Société Anonyme's P/S Mean For Shareholders?
We'd have to say that with no tangible growth over the last year, Bluelinea Société Anonyme's revenue has been unimpressive. One possibility is that the P/S is low because investors think this benign revenue growth rate will likely underperform the broader industry in the near future. If not, then existing shareholders may be feeling optimistic about the future direction of the share price.
Although there are no analyst estimates available for Bluelinea Société Anonyme, take a look at this free data-rich visualisation to see how the company stacks up on earnings, revenue and cash flow.Do Revenue Forecasts Match The Low P/S Ratio?
The only time you'd be truly comfortable seeing a P/S as low as Bluelinea Société Anonyme's is when the company's growth is on track to lag the industry.
Taking a look back first, we see that there was hardly any revenue growth to speak of for the company over the past year. Still, the latest three year period has seen an excellent 34% overall rise in revenue, in spite of its uninspiring short-term performance. Accordingly, shareholders will be pleased, but also have some questions to ponder about the last 12 months.
When compared to the industry's one-year growth forecast of 4.6%, the most recent medium-term revenue trajectory is noticeably more alluring
With this information, we find it odd that Bluelinea Société Anonyme is trading at a P/S lower than the industry. It looks like most investors are not convinced the company can maintain its recent growth rates.
The Key Takeaway
Despite Bluelinea Société Anonyme's share price climbing recently, its P/S still lags most other companies. Using the price-to-sales ratio alone to determine if you should sell your stock isn't sensible, however it can be a practical guide to the company's future prospects.
Our examination of Bluelinea Société Anonyme revealed its three-year revenue trends aren't boosting its P/S anywhere near as much as we would have predicted, given they look better than current industry expectations. When we see strong revenue with faster-than-industry growth, we assume there are some significant underlying risks to the company's ability to make money which is applying downwards pressure on the P/S ratio. While recent revenue trends over the past medium-term suggest that the risk of a price decline is low, investors appear to perceive a likelihood of revenue fluctuations in the future.
It's always necessary to consider the ever-present spectre of investment risk. We've identified 3 warning signs with Bluelinea Société Anonyme (at least 2 which are potentially serious), and understanding them should be part of your investment process.
If you're unsure about the strength of Bluelinea Société Anonyme's business, why not explore our interactive list of stocks with solid business fundamentals for some other companies you may have missed.
Valuation is complex, but we're here to simplify it.
Discover if Bluelinea Société Anonyme might be undervalued or overvalued with our detailed analysis, featuring fair value estimates, potential risks, dividends, insider trades, and its financial condition.
Access Free AnalysisHave feedback on this article? Concerned about the content? Get in touch with us directly. Alternatively, email editorial-team (at) simplywallst.com.
This article by Simply Wall St is general in nature. We provide commentary based on historical data and analyst forecasts only using an unbiased methodology and our articles are not intended to be financial advice. It does not constitute a recommendation to buy or sell any stock, and does not take account of your objectives, or your financial situation. We aim to bring you long-term focused analysis driven by fundamental data. Note that our analysis may not factor in the latest price-sensitive company announcements or qualitative material. Simply Wall St has no position in any stocks mentioned.
About ENXTPA:ALBLU
Bluelinea Société Anonyme
Provides health services for elderly and disabled people in France.
Low risk and slightly overvalued.
Market Insights

Advertisement
Community Narratives
A formidable player in AI and enterprise computing.
Fair Value US$210.00|12.2% overvalued
CO
Community Contributor
IREN's Bold Moves in Sustainable Bitcoin Mining & AI Data Centers
Fair Value US$72.52|17.1% undervalued
BL
Community Contributor
Cooling the Champions: The Aussie Tech Behind F1's Victories
Fair Value AU$12.40|38.1% undervalued
TR
Community Contributor