
Advertisement
A Look At The Intrinsic Value Of Laurent-Perrier S.A. (EPA:LPE)
Key Insights
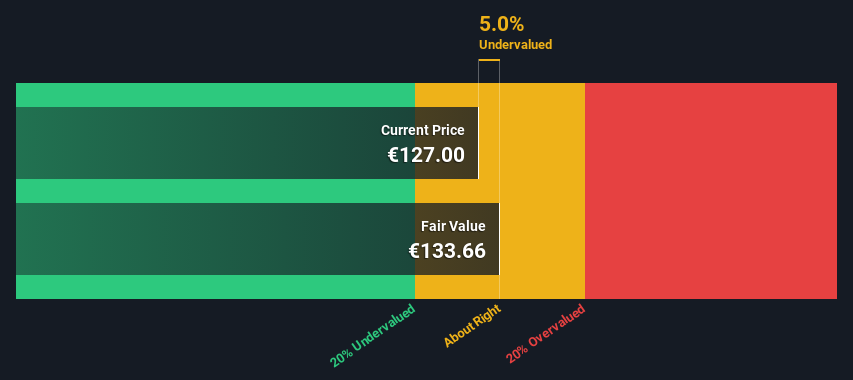
- The projected fair value for Laurent-Perrier is €134 based on 2 Stage Free Cash Flow to Equity
- Current share price of €127 suggests Laurent-Perrier is potentially trading close to its fair value
- The €136 analyst price target for LPE is 2.0% more than our estimate of fair value
How far off is Laurent-Perrier S.A. (EPA:LPE) from its intrinsic value? Using the most recent financial data, we'll take a look at whether the stock is fairly priced by taking the expected future cash flows and discounting them to their present value. Our analysis will employ the Discounted Cash Flow (DCF) model. There's really not all that much to it, even though it might appear quite complex.
We would caution that there are many ways of valuing a company and, like the DCF, each technique has advantages and disadvantages in certain scenarios. For those who are keen learners of equity analysis, the Simply Wall St analysis model here may be something of interest to you.
Check out our latest analysis for Laurent-Perrier
The Model
We're using the 2-stage growth model, which simply means we take in account two stages of company's growth. In the initial period the company may have a higher growth rate and the second stage is usually assumed to have a stable growth rate. In the first stage we need to estimate the cash flows to the business over the next ten years. Where possible we use analyst estimates, but when these aren't available we extrapolate the previous free cash flow (FCF) from the last estimate or reported value. We assume companies with shrinking free cash flow will slow their rate of shrinkage, and that companies with growing free cash flow will see their growth rate slow, over this period. We do this to reflect that growth tends to slow more in the early years than it does in later years.
A DCF is all about the idea that a dollar in the future is less valuable than a dollar today, so we need to discount the sum of these future cash flows to arrive at a present value estimate:
10-year free cash flow (FCF) estimate
| 2024 | 2025 | 2026 | 2027 | 2028 | 2029 | 2030 | 2031 | 2032 | 2033 | |
| Levered FCF (€, Millions) | -€30.3m | €32.5m | €35.9m | €38.2m | €40.1m | €41.6m | €42.8m | €43.8m | €44.6m | €45.3m |
| Growth Rate Estimate Source | Analyst x2 | Analyst x2 | Analyst x2 | Est @ 6.67% | Est @ 4.93% | Est @ 3.71% | Est @ 2.85% | Est @ 2.26% | Est @ 1.84% | Est @ 1.54% |
| Present Value (€, Millions) Discounted @ 5.6% | -€28.7 | €29.1 | €30.4 | €30.7 | €30.6 | €30.0 | €29.2 | €28.3 | €27.3 | €26.2 |
("Est" = FCF growth rate estimated by Simply Wall St)
Present Value of 10-year Cash Flow (PVCF) = €233m
The second stage is also known as Terminal Value, this is the business's cash flow after the first stage. The Gordon Growth formula is used to calculate Terminal Value at a future annual growth rate equal to the 5-year average of the 10-year government bond yield of 0.9%. We discount the terminal cash flows to today's value at a cost of equity of 5.6%.
Terminal Value (TV)= FCF2033 × (1 + g) ÷ (r – g) = €45m× (1 + 0.9%) ÷ (5.6%– 0.9%) = €962m
Present Value of Terminal Value (PVTV)= TV / (1 + r)10= €962m÷ ( 1 + 5.6%)10= €558m
The total value is the sum of cash flows for the next ten years plus the discounted terminal value, which results in the Total Equity Value, which in this case is €791m. To get the intrinsic value per share, we divide this by the total number of shares outstanding. Relative to the current share price of €127, the company appears about fair value at a 5.0% discount to where the stock price trades currently. Valuations are imprecise instruments though, rather like a telescope - move a few degrees and end up in a different galaxy. Do keep this in mind.
The Assumptions
Now the most important inputs to a discounted cash flow are the discount rate, and of course, the actual cash flows. If you don't agree with these result, have a go at the calculation yourself and play with the assumptions. The DCF also does not consider the possible cyclicality of an industry, or a company's future capital requirements, so it does not give a full picture of a company's potential performance. Given that we are looking at Laurent-Perrier as potential shareholders, the cost of equity is used as the discount rate, rather than the cost of capital (or weighted average cost of capital, WACC) which accounts for debt. In this calculation we've used 5.6%, which is based on a levered beta of 0.825. Beta is a measure of a stock's volatility, compared to the market as a whole. We get our beta from the industry average beta of globally comparable companies, with an imposed limit between 0.8 and 2.0, which is a reasonable range for a stable business.
SWOT Analysis for Laurent-Perrier
Strength
- Debt is well covered by earnings.
Weakness
- Earnings declined over the past year.
- Dividend is low compared to the top 25% of dividend payers in the Beverage market.
Opportunity
- Annual earnings are forecast to grow for the next 3 years.
- Current share price is below our estimate of fair value.
Threat
- Debt is not well covered by operating cash flow.
- Dividends are not covered by cash flow.
- Annual earnings are forecast to grow slower than the French market.
Looking Ahead:
Valuation is only one side of the coin in terms of building your investment thesis, and it shouldn't be the only metric you look at when researching a company. The DCF model is not a perfect stock valuation tool. Rather it should be seen as a guide to "what assumptions need to be true for this stock to be under/overvalued?" For instance, if the terminal value growth rate is adjusted slightly, it can dramatically alter the overall result. For Laurent-Perrier, we've put together three pertinent items you should explore:
- Financial Health: Does LPE have a healthy balance sheet? Take a look at our free balance sheet analysis with six simple checks on key factors like leverage and risk.
- Future Earnings: How does LPE's growth rate compare to its peers and the wider market? Dig deeper into the analyst consensus number for the upcoming years by interacting with our free analyst growth expectation chart.
- Other Solid Businesses: Low debt, high returns on equity and good past performance are fundamental to a strong business. Why not explore our interactive list of stocks with solid business fundamentals to see if there are other companies you may not have considered!
PS. The Simply Wall St app conducts a discounted cash flow valuation for every stock on the ENXTPA every day. If you want to find the calculation for other stocks just search here.
New: AI Stock Screener & Alerts
Our new AI Stock Screener scans the market every day to uncover opportunities.
• Dividend Powerhouses (3%+ Yield)
• Undervalued Small Caps with Insider Buying
• High growth Tech and AI Companies
Or build your own from over 50 metrics.
Have feedback on this article? Concerned about the content? Get in touch with us directly. Alternatively, email editorial-team (at) simplywallst.com.
This article by Simply Wall St is general in nature. We provide commentary based on historical data and analyst forecasts only using an unbiased methodology and our articles are not intended to be financial advice. It does not constitute a recommendation to buy or sell any stock, and does not take account of your objectives, or your financial situation. We aim to bring you long-term focused analysis driven by fundamental data. Note that our analysis may not factor in the latest price-sensitive company announcements or qualitative material. Simply Wall St has no position in any stocks mentioned.
About ENXTPA:LPE
Undervalued with excellent balance sheet and pays a dividend.
Market Insights

Advertisement
Weekly Picks
RO


RockeTeller on Santacruz Silver Mining ·
Crazy Undervalued 42 Baggers Silver Play (Active & Running Mine)
Fair Value:CA$8696.7% undervalued
50 followersusers have followed this narrative
6 commentsusers have commented on this narrative
16 likesusers have liked this narrative
RO


Robbo on Fiducian Group ·
Fiducian: Compliance Clouds or Value Opportunity?
Fair Value:AU$122.0% undervalued
7 followersusers have followed this narrative
0 commentsusers have commented on this narrative
0 likesusers have liked this narrative
WO

woodworthfund on Willamette Valley Vineyards ·
Willamette Valley Vineyards (WVVI): Not-So-Great Value
Fair Value:US$247.5% overvalued
10 followersusers have followed this narrative
0 commentsusers have commented on this narrative
1 likeusers have liked this narrative
Recently Updated Narratives
IN

IncomeAssets on Pulse Seismic ·
Watch Pulse Seismic Outperform with 13.6% Revenue Growth in the Coming Years
Fair Value:CA$4.4729.5% undervalued
3 followersusers have followed this narrative
0 commentsusers have commented on this narrative
0 likesusers have liked this narrative
VL

Vladislav on Galleon Gold ·
Significantly undervalued gold explorer in Timmins, finally getting traction
Fair Value:CA$482.8% undervalued
5 followersusers have followed this narrative
0 commentsusers have commented on this narrative
0 likesusers have liked this narrative
FU

FundamentallySarcastic on Credit Corp Group ·
Moderation and Stabilisation: HOLD: Fair Price based on a 4-year Cycle is $12.08
Fair Value:AU$12.6410.8% overvalued
6 followersusers have followed this narrative
0 commentsusers have commented on this narrative
0 likesusers have liked this narrative
Popular Narratives
TH


TheWallstreetKing on MicroVision ·
MicroVision will explode future revenue by 380.37% with a vision towards success
Fair Value:US$6098.5% undervalued
116 followersusers have followed this narrative
11 commentsusers have commented on this narrative
22 likesusers have liked this narrative
AN


AnalystConsensusTarget on NVIDIA ·
NVDA: Expanding AI Demand Will Drive Major Data Center Investments Through 2026
Fair Value:US$250.3926.8% undervalued
957 followersusers have followed this narrative
6 commentsusers have commented on this narrative
25 likesusers have liked this narrative
AN

AnalystConsensusTarget on Alphabet ·
GOOGL: AI Platform Expansion And Cloud Demand Will Support Durable Performance Amid Competitive Pressures
Fair Value:US$323.71.9% undervalued
1341 followersusers have followed this narrative
0 commentsusers have commented on this narrative
17 likesusers have liked this narrative

