

The external fund manager backed by Berkshire Hathaway's Charlie Munger, Li Lu, makes no bones about it when he says 'The biggest investment risk is not the volatility of prices, but whether you will suffer a permanent loss of capital.' So it seems the smart money knows that debt - which is usually involved in bankruptcies - is a very important factor, when you assess how risky a company is. We can see that Accor SA (EPA:AC) does use debt in its business. But the more important question is: how much risk is that debt creating?
When Is Debt A Problem?
Debt assists a business until the business has trouble paying it off, either with new capital or with free cash flow. If things get really bad, the lenders can take control of the business. While that is not too common, we often do see indebted companies permanently diluting shareholders because lenders force them to raise capital at a distressed price. Having said that, the most common situation is where a company manages its debt reasonably well - and to its own advantage. When we examine debt levels, we first consider both cash and debt levels, together.
View our latest analysis for Accor
What Is Accor's Debt?
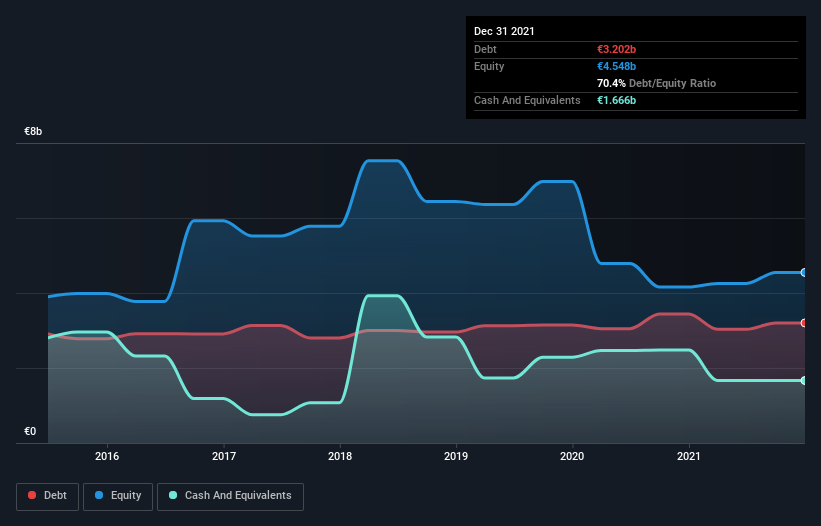
You can click the graphic below for the historical numbers, but it shows that Accor had €3.20b of debt in December 2021, down from €3.44b, one year before. On the flip side, it has €1.67b in cash leading to net debt of about €1.54b.
How Strong Is Accor's Balance Sheet?
Zooming in on the latest balance sheet data, we can see that Accor had liabilities of €2.64b due within 12 months and liabilities of €3.49b due beyond that. Offsetting these obligations, it had cash of €1.67b as well as receivables valued at €921.0m due within 12 months. So its liabilities outweigh the sum of its cash and (near-term) receivables by €3.53b.
Accor has a market capitalization of €8.11b, so it could very likely raise cash to ameliorate its balance sheet, if the need arose. However, it is still worthwhile taking a close look at its ability to pay off debt. When analysing debt levels, the balance sheet is the obvious place to start. But it is future earnings, more than anything, that will determine Accor's ability to maintain a healthy balance sheet going forward. So if you want to see what the professionals think, you might find this free report on analyst profit forecasts to be interesting.
In the last year Accor wasn't profitable at an EBIT level, but managed to grow its revenue by 36%, to €2.2b. Shareholders probably have their fingers crossed that it can grow its way to profits.
Caveat Emptor
Despite the top line growth, Accor still had an earnings before interest and tax (EBIT) loss over the last year. To be specific the EBIT loss came in at €227m. Considering that alongside the liabilities mentioned above does not give us much confidence that company should be using so much debt. Quite frankly we think the balance sheet is far from match-fit, although it could be improved with time. Another cause for caution is that is bled €282m in negative free cash flow over the last twelve months. So suffice it to say we do consider the stock to be risky. When we look at a riskier company, we like to check how their profits (or losses) are trending over time. Today, we're providing readers this interactive graph showing how Accor's profit, revenue, and operating cashflow have changed over the last few years.
If, after all that, you're more interested in a fast growing company with a rock-solid balance sheet, then check out our list of net cash growth stocks without delay.
New: Manage All Your Stock Portfolios in One Place
We've created the ultimate portfolio companion for stock investors, and it's free.
• Connect an unlimited number of Portfolios and see your total in one currency
• Be alerted to new Warning Signs or Risks via email or mobile
• Track the Fair Value of your stocks
Have feedback on this article? Concerned about the content? Get in touch with us directly. Alternatively, email editorial-team (at) simplywallst.com.
This article by Simply Wall St is general in nature. We provide commentary based on historical data and analyst forecasts only using an unbiased methodology and our articles are not intended to be financial advice. It does not constitute a recommendation to buy or sell any stock, and does not take account of your objectives, or your financial situation. We aim to bring you long-term focused analysis driven by fundamental data. Note that our analysis may not factor in the latest price-sensitive company announcements or qualitative material. Simply Wall St has no position in any stocks mentioned.
About ENXTPA:AC
Adequate balance sheet average dividend payer.

