
Advertisement
- France
- /
- Consumer Durables
- /
- ENXTPA:ALAST
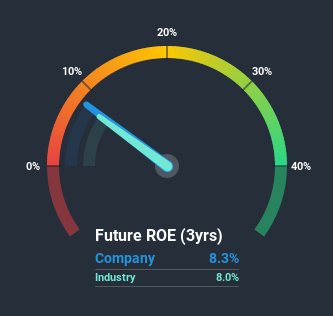
With A Return On Equity Of 8.3%, Has AST Groupe's (EPA:ASP) Management Done Well?
Many investors are still learning about the various metrics that can be useful when analysing a stock. This article is for those who would like to learn about Return On Equity (ROE). By way of learning-by-doing, we'll look at ROE to gain a better understanding of AST Groupe (EPA:ASP).
Return on Equity or ROE is a test of how effectively a company is growing its value and managing investors’ money. In short, ROE shows the profit each dollar generates with respect to its shareholder investments.
View our latest analysis for AST Groupe
How Is ROE Calculated?
Return on equity can be calculated by using the formula:
Return on Equity = Net Profit (from continuing operations) ÷ Shareholders' Equity
So, based on the above formula, the ROE for AST Groupe is:
8.3% = €3.0m ÷ €36m (Based on the trailing twelve months to June 2020).
The 'return' is the amount earned after tax over the last twelve months. So, this means that for every €1 of its shareholder's investments, the company generates a profit of €0.08.
Does AST Groupe Have A Good Return On Equity?
One simple way to determine if a company has a good return on equity is to compare it to the average for its industry. The limitation of this approach is that some companies are quite different from others, even within the same industry classification. If you look at the image below, you can see AST Groupe has a similar ROE to the average in the Consumer Durables industry classification (8.0%).
That's neither particularly good, nor bad. Although the ROE is similar to the industry, we should still perform further checks to see if the company's ROE is being boosted by high debt levels. If true, then it is more an indication of risk than the potential. Our risks dashboardshould have the 2 risks we have identified for AST Groupe.
How Does Debt Impact Return On Equity?
Most companies need money -- from somewhere -- to grow their profits. That cash can come from issuing shares, retained earnings, or debt. In the first two cases, the ROE will capture this use of capital to grow. In the latter case, the debt used for growth will improve returns, but won't affect the total equity. In this manner the use of debt will boost ROE, even though the core economics of the business stay the same.
Combining AST Groupe's Debt And Its 8.3% Return On Equity
It's worth noting the high use of debt by AST Groupe, leading to its debt to equity ratio of 1.15. Its ROE is quite low, even with the use of significant debt; that's not a good result, in our opinion. Debt increases risk and reduces options for the company in the future, so you generally want to see some good returns from using it.
Conclusion
Return on equity is useful for comparing the quality of different businesses. A company that can achieve a high return on equity without debt could be considered a high quality business. If two companies have around the same level of debt to equity, and one has a higher ROE, I'd generally prefer the one with higher ROE.
But ROE is just one piece of a bigger puzzle, since high quality businesses often trade on high multiples of earnings. Profit growth rates, versus the expectations reflected in the price of the stock, are a particularly important to consider. So you might want to take a peek at this data-rich interactive graph of forecasts for the company.
But note: AST Groupe may not be the best stock to buy. So take a peek at this free list of interesting companies with high ROE and low debt.
If you’re looking to trade AST Groupe, open an account with the lowest-cost* platform trusted by professionals, Interactive Brokers. Their clients from over 200 countries and territories trade stocks, options, futures, forex, bonds and funds worldwide from a single integrated account. Promoted
New: Manage All Your Stock Portfolios in One Place
We've created the ultimate portfolio companion for stock investors, and it's free.
• Connect an unlimited number of Portfolios and see your total in one currency
• Be alerted to new Warning Signs or Risks via email or mobile
• Track the Fair Value of your stocks
This article by Simply Wall St is general in nature. It does not constitute a recommendation to buy or sell any stock, and does not take account of your objectives, or your financial situation. We aim to bring you long-term focused analysis driven by fundamental data. Note that our analysis may not factor in the latest price-sensitive company announcements or qualitative material. Simply Wall St has no position in any stocks mentioned.
*Interactive Brokers Rated Lowest Cost Broker by StockBrokers.com Annual Online Review 2020
Have feedback on this article? Concerned about the content? Get in touch with us directly. Alternatively, email editorial-team (at) simplywallst.com.
About ENXTPA:ALAST
Very low with weak fundamentals.
Market Insights

Advertisement
Weekly Picks
WO

woodworthfund on MGP Ingredients ·
THE KINGDOM OF BROWN GOODS: WHY MGPI IS BEING CRUSHED BY INVENTORY & PRIMED FOR RESURRECTION
Fair Value:US$4034.1% undervalued
19 followersusers have followed this narrative
1 commentusers have commented on this narrative
5 likesusers have liked this narrative
DO


Double_Bubbler on Vertical Aerospace ·
Why Vertical Aerospace (NYSE: EVTL) is Worth Possibly Over 13x its Current Price
Fair Value:US$6090.0% undervalued
22 followersusers have followed this narrative
2 commentsusers have commented on this narrative
17 likesusers have liked this narrative
TI


TickerTickle on Oracle ·
The Quiet Giant That Became AI’s Power Grid
Fair Value:US$389.8142.8% undervalued
42 followersusers have followed this narrative
3 commentsusers have commented on this narrative
8 likesusers have liked this narrative
Recently Updated Narratives
MH


mhbb on Mastersystem Infotama ·
Mastersystem Infotama will achieve 18.9% revenue growth as fair value hits IDR1,650
Fair Value:Rp1.63k13.8% undervalued
1 followerusers have followed this narrative
0 commentsusers have commented on this narrative
0 likesusers have liked this narrative
RO


Robbo on Procter & Gamble ·
Insiders Sell, Investors Watch: What’s Going On at PG?
Fair Value:US$1506.8% undervalued
2 followersusers have followed this narrative
0 commentsusers have commented on this narrative
0 likesusers have liked this narrative
CW

Cwburton on Verano Holdings ·
Waiting for the Inevitable
Fair Value:CA$5.5278.8% undervalued
2 followersusers have followed this narrative
0 commentsusers have commented on this narrative
0 likesusers have liked this narrative
Popular Narratives
TH


TheWallstreetKing on MicroVision ·
MicroVision will explode future revenue by 380.37% with a vision towards success
Fair Value:US$6098.5% undervalued
119 followersusers have followed this narrative
11 commentsusers have commented on this narrative
22 likesusers have liked this narrative
AN


AnalystConsensusTarget on NVIDIA ·
NVDA: Expanding AI Demand Will Drive Major Data Center Investments Through 2026
Fair Value:US$250.3926.6% undervalued
963 followersusers have followed this narrative
6 commentsusers have commented on this narrative
25 likesusers have liked this narrative
RO


RockeTeller on Santacruz Silver Mining ·
Crazy Undervalued 42 Baggers Silver Play (Active & Running Mine)
Fair Value:CA$8684.3% undervalued
77 followersusers have followed this narrative
8 commentsusers have commented on this narrative
21 likesusers have liked this narrative
Trending Discussion

OI


OilStates on Oil States International ·
The article’s takeaways do not reflect Oil States’ current business mix or market realities. Nearly 75% of Company revenues now come from offshore and international projects, where industry investment is strengthening, not declining, and backlog is at the highest level in a decade. Oil States has intentionally exited lower-margin U.S. land markets, resulting in expanding margins, strong free cash flow, and a near-zero net-debt profile. Our offerings are concentrated in high-barrier, engineered offshore technologies where competitive pressure and regulatory risk are far lower than implied. These fundamentals therefore do not align with the structural-decline narrative presented. Find out more about the strong offshore/international, cash generation, and valuation upside potential in our latest investor presentation available here: https://ir.oilstatesintl.com/events-and-presentations/default.aspx
0
|0