- France
- /
- Professional Services
- /
- ENXTPA:SDG
Returns On Capital At Synergie (EPA:SDG) Paint A Concerning Picture


What trends should we look for it we want to identify stocks that can multiply in value over the long term? In a perfect world, we'd like to see a company investing more capital into its business and ideally the returns earned from that capital are also increasing. Basically this means that a company has profitable initiatives that it can continue to reinvest in, which is a trait of a compounding machine. In light of that, when we looked at Synergie (EPA:SDG) and its ROCE trend, we weren't exactly thrilled.
We check all companies for important risks. See what we found for Synergie in our free report.Return On Capital Employed (ROCE): What Is It?
Just to clarify if you're unsure, ROCE is a metric for evaluating how much pre-tax income (in percentage terms) a company earns on the capital invested in its business. Analysts use this formula to calculate it for Synergie:
Return on Capital Employed = Earnings Before Interest and Tax (EBIT) ÷ (Total Assets - Current Liabilities)
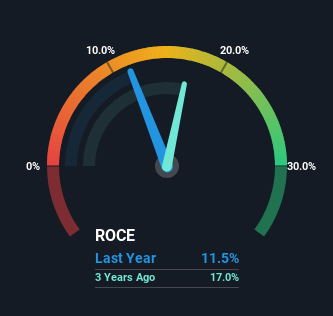
0.11 = €96m ÷ (€1.5b - €655m) (Based on the trailing twelve months to December 2024).
So, Synergie has an ROCE of 11%. In absolute terms, that's a satisfactory return, but compared to the Professional Services industry average of 9.5% it's much better.
See our latest analysis for Synergie
In the above chart we have measured Synergie's prior ROCE against its prior performance, but the future is arguably more important. If you'd like to see what analysts are forecasting going forward, you should check out our free analyst report for Synergie .
The Trend Of ROCE
In terms of Synergie's historical ROCE movements, the trend isn't fantastic. To be more specific, ROCE has fallen from 18% over the last five years. On the other hand, the company has been employing more capital without a corresponding improvement in sales in the last year, which could suggest these investments are longer term plays. It may take some time before the company starts to see any change in earnings from these investments.
On a separate but related note, it's important to know that Synergie has a current liabilities to total assets ratio of 44%, which we'd consider pretty high. This can bring about some risks because the company is basically operating with a rather large reliance on its suppliers or other sorts of short-term creditors. While it's not necessarily a bad thing, it can be beneficial if this ratio is lower.
The Bottom Line On Synergie's ROCE
To conclude, we've found that Synergie is reinvesting in the business, but returns have been falling. Although the market must be expecting these trends to improve because the stock has gained 88% over the last five years. However, unless these underlying trends turn more positive, we wouldn't get our hopes up too high.
While Synergie doesn't shine too bright in this respect, it's still worth seeing if the company is trading at attractive prices. You can find that out with our FREE intrinsic value estimation for SDG on our platform.
While Synergie may not currently earn the highest returns, we've compiled a list of companies that currently earn more than 25% return on equity. Check out this free list here.
New: Manage All Your Stock Portfolios in One Place
We've created the ultimate portfolio companion for stock investors, and it's free.
• Connect an unlimited number of Portfolios and see your total in one currency
• Be alerted to new Warning Signs or Risks via email or mobile
• Track the Fair Value of your stocks
Have feedback on this article? Concerned about the content? Get in touch with us directly. Alternatively, email editorial-team (at) simplywallst.com.
This article by Simply Wall St is general in nature. We provide commentary based on historical data and analyst forecasts only using an unbiased methodology and our articles are not intended to be financial advice. It does not constitute a recommendation to buy or sell any stock, and does not take account of your objectives, or your financial situation. We aim to bring you long-term focused analysis driven by fundamental data. Note that our analysis may not factor in the latest price-sensitive company announcements or qualitative material. Simply Wall St has no position in any stocks mentioned.
About ENXTPA:SDG
Synergie
Provides human resources management and development services for companies and institutions in France, Belgium, Other Northern and Eastern Europe, Italy, Spain, Portugal, Canada, and Australia.
Flawless balance sheet and good value.
Similar Companies
Market Insights

Community Narratives

