- France
- /
- Professional Services
- /
- ENXTPA:ALFRE
Did You Participate In Any Of Freelance.com's (EPA:ALFRE) Incredible 572% Return?

Long term investing can be life changing when you buy and hold the truly great businesses. While not every stock performs well, when investors win, they can win big. For example, the Freelance.com SA (EPA:ALFRE) share price is up a whopping 548% in the last half decade, a handsome return for long term holders. And this is just one example of the epic gains achieved by some long term investors. It's down 1.4% in the last seven days.
Anyone who held for that rewarding ride would probably be keen to talk about it.
See our latest analysis for Freelance.com
To paraphrase Benjamin Graham: Over the short term the market is a voting machine, but over the long term it's a weighing machine. One way to examine how market sentiment has changed over time is to look at the interaction between a company's share price and its earnings per share (EPS).
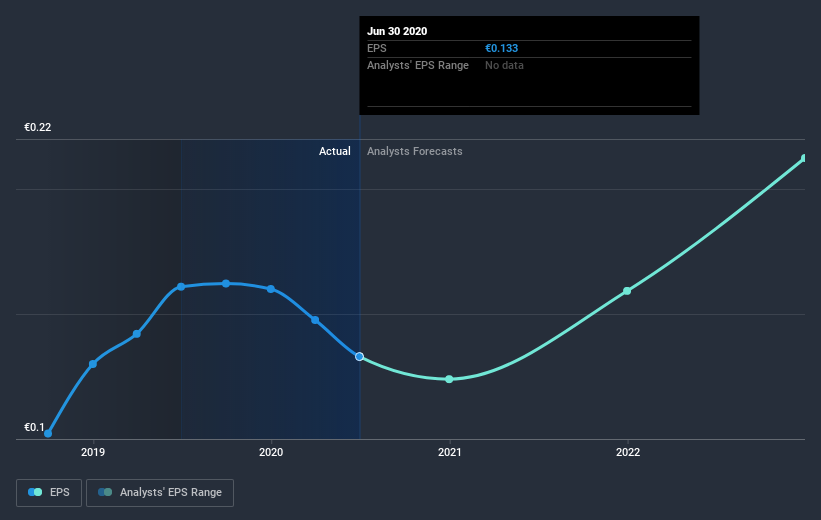
During the five years of share price growth, Freelance.com moved from a loss to profitability. Sometimes, the start of profitability is a major inflection point that can signal fast earnings growth to come, which in turn justifies very strong share price gains. Since the company was unprofitable five years ago, but not three years ago, it's worth taking a look at the returns in the last three years, too. Indeed, the Freelance.com share price has gained 175% in three years. In the same period, EPS is up 43% per year. That makes the EPS growth rather close to the annualized share price gain of 40% over the same period. So one might argue that investor sentiment towards the stock hss not changed much over time. Arguably the share price is reflecting the earnings per share.
You can see below how EPS has changed over time (discover the exact values by clicking on the image).

It's probably worth noting that the CEO is paid less than the median at similar sized companies. It's always worth keeping an eye on CEO pay, but a more important question is whether the company will grow earnings throughout the years. Before buying or selling a stock, we always recommend a close examination of historic growth trends, available here..
What about the Total Shareholder Return (TSR)?
We'd be remiss not to mention the difference between Freelance.com's total shareholder return (TSR) and its share price return. The TSR attempts to capture the value of dividends (as if they were reinvested) as well as any spin-offs or discounted capital raisings offered to shareholders. Dividends have been really beneficial for Freelance.com shareholders, and that cash payout contributed to why its TSR of 572%, over the last 5 years, is better than the share price return.
A Different Perspective
It's good to see that Freelance.com has rewarded shareholders with a total shareholder return of 69% in the last twelve months. That's better than the annualised return of 46% over half a decade, implying that the company is doing better recently. Given the share price momentum remains strong, it might be worth taking a closer look at the stock, lest you miss an opportunity. While it is well worth considering the different impacts that market conditions can have on the share price, there are other factors that are even more important. For example, we've discovered 2 warning signs for Freelance.com that you should be aware of before investing here.
Of course Freelance.com may not be the best stock to buy. So you may wish to see this free collection of growth stocks.
Please note, the market returns quoted in this article reflect the market weighted average returns of stocks that currently trade on FR exchanges.
If you decide to trade Freelance.com, use the lowest-cost* platform that is rated #1 Overall by Barron’s, Interactive Brokers. Trade stocks, options, futures, forex, bonds and funds on 135 markets, all from a single integrated account. Promoted
New: AI Stock Screener & Alerts
Our new AI Stock Screener scans the market every day to uncover opportunities.
• Dividend Powerhouses (3%+ Yield)
• Undervalued Small Caps with Insider Buying
• High growth Tech and AI Companies
Or build your own from over 50 metrics.
This article by Simply Wall St is general in nature. It does not constitute a recommendation to buy or sell any stock, and does not take account of your objectives, or your financial situation. We aim to bring you long-term focused analysis driven by fundamental data. Note that our analysis may not factor in the latest price-sensitive company announcements or qualitative material. Simply Wall St has no position in any stocks mentioned.
*Interactive Brokers Rated Lowest Cost Broker by StockBrokers.com Annual Online Review 2020
Have feedback on this article? Concerned about the content? Get in touch with us directly. Alternatively, email editorial-team@simplywallst.com.
About ENXTPA:ALFRE
Freelance.com
Provides intermediation between companies and intellectual service providers in France, Germany, the United Kingdom, Morocco, Luxembourg, Switzerland, and Singapore.
Very undervalued with solid track record.
Market Insights
Community Narratives


