

If we want to find a stock that could multiply over the long term, what are the underlying trends we should look for? Firstly, we'd want to identify a growing return on capital employed (ROCE) and then alongside that, an ever-increasing base of capital employed. Ultimately, this demonstrates that it's a business that is reinvesting profits at increasing rates of return. Although, when we looked at Haulotte Group (EPA:PIG), it didn't seem to tick all of these boxes.
Return On Capital Employed (ROCE): What Is It?
If you haven't worked with ROCE before, it measures the 'return' (pre-tax profit) a company generates from capital employed in its business. To calculate this metric for Haulotte Group, this is the formula:
Return on Capital Employed = Earnings Before Interest and Tax (EBIT) ÷ (Total Assets - Current Liabilities)
0.11 = €32m ÷ (€660m - €370m) (Based on the trailing twelve months to December 2023).
So, Haulotte Group has an ROCE of 11%. In absolute terms, that's a satisfactory return, but compared to the Machinery industry average of 7.5% it's much better.
View our latest analysis for Haulotte Group
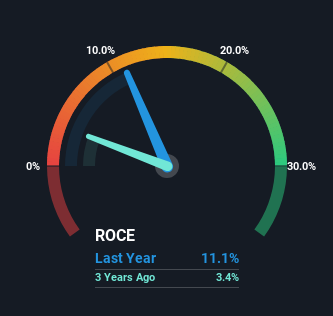
Above you can see how the current ROCE for Haulotte Group compares to its prior returns on capital, but there's only so much you can tell from the past. If you're interested, you can view the analysts predictions in our free analyst report for Haulotte Group .
How Are Returns Trending?
Over the past five years, Haulotte Group's ROCE and capital employed have both remained mostly flat. This tells us the company isn't reinvesting in itself, so it's plausible that it's past the growth phase. So don't be surprised if Haulotte Group doesn't end up being a multi-bagger in a few years time.
Another point to note, we noticed the company has increased current liabilities over the last five years. This is intriguing because if current liabilities hadn't increased to 56% of total assets, this reported ROCE would probably be less than11% because total capital employed would be higher.The 11% ROCE could be even lower if current liabilities weren't 56% of total assets, because the the formula would show a larger base of total capital employed. Additionally, this high level of current liabilities isn't ideal because it means the company's suppliers (or short-term creditors) are effectively funding a large portion of the business.
What We Can Learn From Haulotte Group's ROCE
In a nutshell, Haulotte Group has been trudging along with the same returns from the same amount of capital over the last five years. And investors appear hesitant that the trends will pick up because the stock has fallen 64% in the last five years. On the whole, we aren't too inspired by the underlying trends and we think there may be better chances of finding a multi-bagger elsewhere.
If you'd like to know more about Haulotte Group, we've spotted 2 warning signs, and 1 of them is a bit concerning.
If you want to search for solid companies with great earnings, check out this free list of companies with good balance sheets and impressive returns on equity.
Valuation is complex, but we're here to simplify it.
Discover if Haulotte Group might be undervalued or overvalued with our detailed analysis, featuring fair value estimates, potential risks, dividends, insider trades, and its financial condition.
Access Free AnalysisHave feedback on this article? Concerned about the content? Get in touch with us directly. Alternatively, email editorial-team (at) simplywallst.com.
This article by Simply Wall St is general in nature. We provide commentary based on historical data and analyst forecasts only using an unbiased methodology and our articles are not intended to be financial advice. It does not constitute a recommendation to buy or sell any stock, and does not take account of your objectives, or your financial situation. We aim to bring you long-term focused analysis driven by fundamental data. Note that our analysis may not factor in the latest price-sensitive company announcements or qualitative material. Simply Wall St has no position in any stocks mentioned.
About ENXTPA:PIG
Haulotte Group
Through its subsidiaries, designs, manufactures, and markets people and material lifting equipment.
Undervalued with mediocre balance sheet.
Similar Companies
Market Insights

Community Narratives
