
Advertisement
0.9% earnings growth over 5 years has not materialized into gains for Manitou BF (EPA:MTU) shareholders over that period

For many, the main point of investing is to generate higher returns than the overall market. But even the best stock picker will only win with some selections. At this point some shareholders may be questioning their investment in Manitou BF SA (EPA:MTU), since the last five years saw the share price fall 25%. More recently, the share price has dropped a further 18% in a month.
With the stock having lost 8.8% in the past week, it's worth taking a look at business performance and seeing if there's any red flags.
View our latest analysis for Manitou BF
While markets are a powerful pricing mechanism, share prices reflect investor sentiment, not just underlying business performance. One imperfect but simple way to consider how the market perception of a company has shifted is to compare the change in the earnings per share (EPS) with the share price movement.
During the unfortunate half decade during which the share price slipped, Manitou BF actually saw its earnings per share (EPS) improve by 4.6% per year. Given the share price reaction, one might suspect that EPS is not a good guide to the business performance during the period (perhaps due to a one-off loss or gain). Alternatively, growth expectations may have been unreasonable in the past.
Based on these numbers, we'd venture that the market may have been over-optimistic about forecast growth, half a decade ago. Looking to other metrics might better explain the share price change.
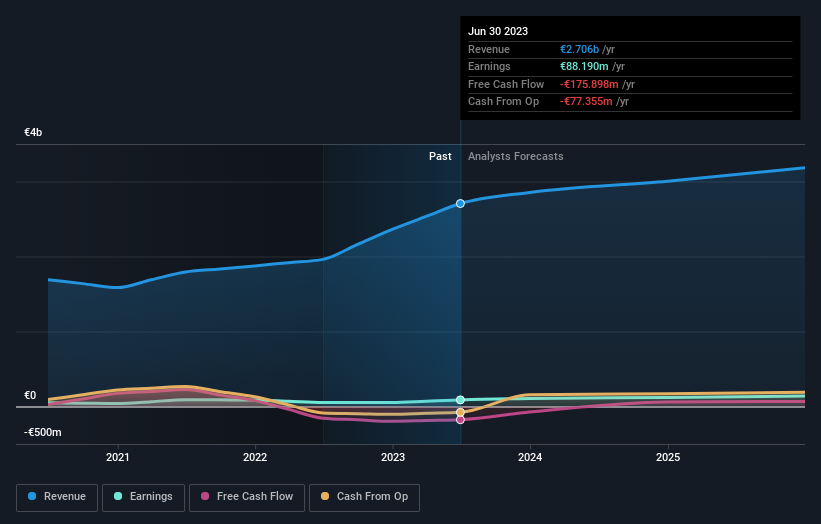
In contrast to the share price, revenue has actually increased by 4.9% a year in the five year period. So it seems one might have to take closer look at the fundamentals to understand why the share price languishes. After all, there may be an opportunity.
The graphic below depicts how earnings and revenue have changed over time (unveil the exact values by clicking on the image).
We know that Manitou BF has improved its bottom line lately, but what does the future have in store? So it makes a lot of sense to check out what analysts think Manitou BF will earn in the future (free profit forecasts).
What About Dividends?
It is important to consider the total shareholder return, as well as the share price return, for any given stock. The TSR incorporates the value of any spin-offs or discounted capital raisings, along with any dividends, based on the assumption that the dividends are reinvested. So for companies that pay a generous dividend, the TSR is often a lot higher than the share price return. As it happens, Manitou BF's TSR for the last 5 years was -14%, which exceeds the share price return mentioned earlier. And there's no prize for guessing that the dividend payments largely explain the divergence!
A Different Perspective
Manitou BF's TSR for the year was broadly in line with the market average, at 20%. To take a positive view, the gain is pleasing, and it sure beats annualized TSR loss of 3%, which was endured over half a decade. While 'turnarounds seldom turn' there are green shoots for Manitou BF. I find it very interesting to look at share price over the long term as a proxy for business performance. But to truly gain insight, we need to consider other information, too. Case in point: We've spotted 3 warning signs for Manitou BF you should be aware of, and 2 of them shouldn't be ignored.
But note: Manitou BF may not be the best stock to buy. So take a peek at this free list of interesting companies with past earnings growth (and further growth forecast).
Please note, the market returns quoted in this article reflect the market weighted average returns of stocks that currently trade on French exchanges.
New: Manage All Your Stock Portfolios in One Place
We've created the ultimate portfolio companion for stock investors, and it's free.
• Connect an unlimited number of Portfolios and see your total in one currency
• Be alerted to new Warning Signs or Risks via email or mobile
• Track the Fair Value of your stocks
Have feedback on this article? Concerned about the content? Get in touch with us directly. Alternatively, email editorial-team (at) simplywallst.com.
This article by Simply Wall St is general in nature. We provide commentary based on historical data and analyst forecasts only using an unbiased methodology and our articles are not intended to be financial advice. It does not constitute a recommendation to buy or sell any stock, and does not take account of your objectives, or your financial situation. We aim to bring you long-term focused analysis driven by fundamental data. Note that our analysis may not factor in the latest price-sensitive company announcements or qualitative material. Simply Wall St has no position in any stocks mentioned.
About ENXTPA:MTU
Manitou BF
Engages in the development, manufacture, and distribution of equipment and services in the France, Southern Europe, Northern Europe, the Americas, Asia, the Pacific, Africa, and the Middle East.
Very undervalued with excellent balance sheet and pays a dividend.
Similar Companies
Market Insights

Advertisement
Community Narratives
Groundbreaking therapies that could change the treatment landscape for PTSD, fibromyalgia, MS & Alzheimer’s
Fair Value US$6.20|86.9% undervalued
CM
Community Contributor
DigitalOcean Will Grow 14% by Embracing AI with Paperspace Acquisition
Fair Value US$50.00|40.2% undervalued
NE
Community Contributor
Viant Technology: A Rising AdTech Challenger in the AI-Powered CTV Market
Fair Value US$38.61|62.7% undervalued
BL
Community Contributor
Volvo will Accelerate Forward into Electric and Autonomous Leadership in Five Years
Fair Value SEK 438.80|40.1% undervalued
UN
Community Contributor