

Some say volatility, rather than debt, is the best way to think about risk as an investor, but Warren Buffett famously said that 'Volatility is far from synonymous with risk.' So it might be obvious that you need to consider debt, when you think about how risky any given stock is, because too much debt can sink a company. Importantly, Legrand SA (EPA:LR) does carry debt. But the more important question is: how much risk is that debt creating?
Why Does Debt Bring Risk?
Debt and other liabilities become risky for a business when it cannot easily fulfill those obligations, either with free cash flow or by raising capital at an attractive price. If things get really bad, the lenders can take control of the business. However, a more common (but still painful) scenario is that it has to raise new equity capital at a low price, thus permanently diluting shareholders. Having said that, the most common situation is where a company manages its debt reasonably well - and to its own advantage. When we think about a company's use of debt, we first look at cash and debt together.
See our latest analysis for Legrand
How Much Debt Does Legrand Carry?
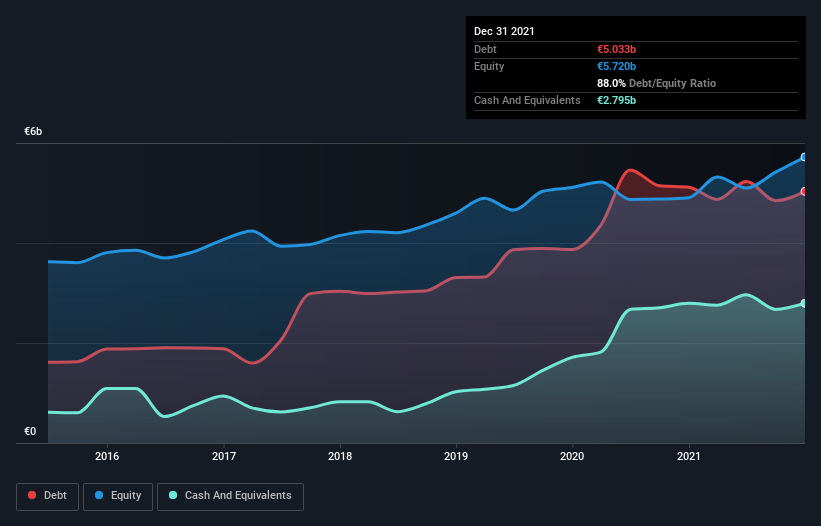
The chart below, which you can click on for greater detail, shows that Legrand had €5.03b in debt in December 2021; about the same as the year before. However, it also had €2.79b in cash, and so its net debt is €2.24b.
How Strong Is Legrand's Balance Sheet?
The latest balance sheet data shows that Legrand had liabilities of €2.59b due within a year, and liabilities of €5.72b falling due after that. Offsetting this, it had €2.79b in cash and €1.00b in receivables that were due within 12 months. So its liabilities outweigh the sum of its cash and (near-term) receivables by €4.51b.
Given Legrand has a humongous market capitalization of €22.6b, it's hard to believe these liabilities pose much threat. Having said that, it's clear that we should continue to monitor its balance sheet, lest it change for the worse.
In order to size up a company's debt relative to its earnings, we calculate its net debt divided by its earnings before interest, tax, depreciation, and amortization (EBITDA) and its earnings before interest and tax (EBIT) divided by its interest expense (its interest cover). The advantage of this approach is that we take into account both the absolute quantum of debt (with net debt to EBITDA) and the actual interest expenses associated with that debt (with its interest cover ratio).
Legrand's net debt is only 1.4 times its EBITDA. And its EBIT covers its interest expense a whopping 16.0 times over. So you could argue it is no more threatened by its debt than an elephant is by a mouse. Another good sign is that Legrand has been able to increase its EBIT by 26% in twelve months, making it easier to pay down debt. The balance sheet is clearly the area to focus on when you are analysing debt. But it is future earnings, more than anything, that will determine Legrand's ability to maintain a healthy balance sheet going forward. So if you want to see what the professionals think, you might find this free report on analyst profit forecasts to be interesting.
But our final consideration is also important, because a company cannot pay debt with paper profits; it needs cold hard cash. So we always check how much of that EBIT is translated into free cash flow. Over the last three years, Legrand recorded free cash flow worth a fulsome 82% of its EBIT, which is stronger than we'd usually expect. That puts it in a very strong position to pay down debt.
Our View
Happily, Legrand's impressive interest cover implies it has the upper hand on its debt. And the good news does not stop there, as its conversion of EBIT to free cash flow also supports that impression! Zooming out, Legrand seems to use debt quite reasonably; and that gets the nod from us. While debt does bring risk, when used wisely it can also bring a higher return on equity. Above most other metrics, we think its important to track how fast earnings per share is growing, if at all. If you've also come to that realization, you're in luck, because today you can view this interactive graph of Legrand's earnings per share history for free.
If, after all that, you're more interested in a fast growing company with a rock-solid balance sheet, then check out our list of net cash growth stocks without delay.
New: AI Stock Screener & Alerts
Our new AI Stock Screener scans the market every day to uncover opportunities.
• Dividend Powerhouses (3%+ Yield)
• Undervalued Small Caps with Insider Buying
• High growth Tech and AI Companies
Or build your own from over 50 metrics.
Have feedback on this article? Concerned about the content? Get in touch with us directly. Alternatively, email editorial-team (at) simplywallst.com.
This article by Simply Wall St is general in nature. We provide commentary based on historical data and analyst forecasts only using an unbiased methodology and our articles are not intended to be financial advice. It does not constitute a recommendation to buy or sell any stock, and does not take account of your objectives, or your financial situation. We aim to bring you long-term focused analysis driven by fundamental data. Note that our analysis may not factor in the latest price-sensitive company announcements or qualitative material. Simply Wall St has no position in any stocks mentioned.
About ENXTPA:LR
Legrand
Manufactures, distributes, and sells electrical and digital building infrastructures in Europe, North and Central America, and internationally.
Excellent balance sheet established dividend payer.
Similar Companies
Market Insights

Community Narratives

