Advertisement
- France
- /
- Trade Distributors
- /
- ENXTPA:ALUPG
European Penny Stocks Spotlight: UPERGY Société Anonyme Leads 3 Promising Picks

Simply Wall St
Reviewed by Simply Wall St

Amidst the mixed economic signals across Europe, where inflation rates and GDP growth vary by country, the pan-European STOXX Europe 600 Index has managed to maintain a positive trajectory. For investors willing to explore beyond established market leaders, penny stocks—typically smaller or newer companies—continue to offer intriguing potential. Despite being an older term in investment circles, penny stocks remain relevant today as they often combine affordability with growth opportunities. In this article, we spotlight three European penny stocks that stand out for their financial resilience and potential for value discovery.
Top 10 Penny Stocks In Europe
| Name | Share Price | Market Cap | Financial Health Rating |
| Angler Gaming (NGM:ANGL) | SEK3.75 | SEK281.19M | ★★★★★★ |
| Transferator (NGM:TRAN A) | SEK2.22 | SEK210.72M | ★★★★★★ |
| High (ENXTPA:HCO) | €2.73 | €53.62M | ★★★★★★ |
| Netgem (ENXTPA:ALNTG) | €0.998 | €33.42M | ★★★★★★ |
| Hifab Group (OM:HIFA B) | SEK4.00 | SEK243.36M | ★★★★★★ |
| Bredband2 i Skandinavien (OM:BRE2) | SEK1.992 | SEK1.91B | ★★★★☆☆ |
| Deceuninck (ENXTBR:DECB) | €2.19 | €303.09M | ★★★★★★ |
| I.M.D. International Medical Devices (BIT:IMD) | €1.40 | €24.25M | ★★★★★☆ |
| Nurminen Logistics Oyj (HLSE:NLG1V) | €1.06 | €85.39M | ★★★★★☆ |
| Arcure (ENXTPA:ALCUR) | €4.92 | €28.44M | ★★★★☆☆ |
Click here to see the full list of 435 stocks from our European Penny Stocks screener.
We'll examine a selection from our screener results.
UPERGY Société Anonyme (ENXTPA:ALUPG)
Simply Wall St Financial Health Rating: ★★★★★☆
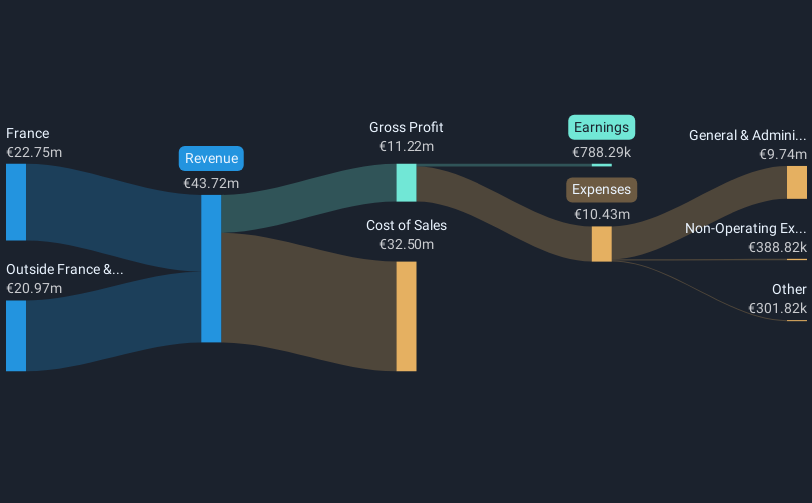
Overview: UPERGY Société Anonyme manufactures and distributes batteries both in France and internationally, with a market cap of €10.98 million.
Operations: The company generates €43.72 million in revenue from its Battery Division.
Market Cap: €10.98M
UPERGY Société Anonyme, with a market cap of €10.98 million, generates €43.72 million in revenue from its Battery Division. The management team and board are experienced, with average tenures of 2.2 and 5.2 years respectively. Short-term assets (€25M) exceed both short-term (€13.6M) and long-term liabilities (€3.8M), indicating a strong liquidity position despite low return on equity (5.4%). While the company has become profitable over five years, recent earnings growth was negative (-3.1%). Debt levels have improved significantly but remain not well covered by operating cash flow (8.8%), though interest payments are adequately covered by EBIT (3.1x).
- Unlock comprehensive insights into our analysis of UPERGY Société Anonyme stock in this financial health report.
- Understand UPERGY Société Anonyme's earnings outlook by examining our growth report.
Tecnotree Oyj (HLSE:TEM1V)
Simply Wall St Financial Health Rating: ★★★★★★
Overview: Tecnotree Oyj provides telecommunication IT solutions for charging, billing, customer care, and messaging and content services across Europe, the Americas, the Middle East, Africa, and the Asia Pacific with a market cap of €58.40 million.
Operations: The company's revenue is segmented into €16.7 million from Europe and the Americas, and €54.8 million from the Middle East, Africa, and Asia Pacific regions.
Market Cap: €58.4M
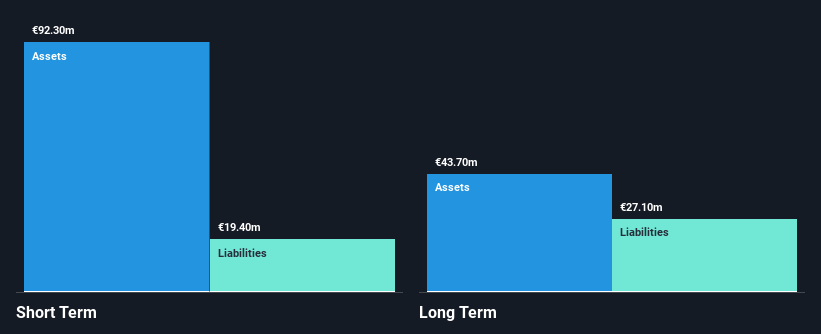
Tecnotree Oyj, with a market cap of €58.40 million, has shown resilience despite recent challenges. The company reported annual sales of €71.6 million for 2024, slightly down from the previous year. Its net income also declined to €8.3 million from €11.2 million, yet earnings per share improved significantly due to operational efficiencies and strategic initiatives like its multi-year agreement with a US telecom operator. Tecnotree's balance sheet is robust; short-term assets (€93.3M) exceed both short-term (€19M) and long-term liabilities (€27.3M). While its share price remains volatile, the debt-to-equity ratio has improved markedly over five years.
- Click to explore a detailed breakdown of our findings in Tecnotree Oyj's financial health report.
- Review our growth performance report to gain insights into Tecnotree Oyj's future.
Saga Pure (OB:SAGA)
Simply Wall St Financial Health Rating: ★★★★★★
Overview: Saga Pure ASA is an investment company involved in the management and investment within the industry, energy, and real estate sectors, with a market cap of NOK620.64 million.
Operations: Saga Pure ASA does not report any specific revenue segments.
Market Cap: NOK620.64M
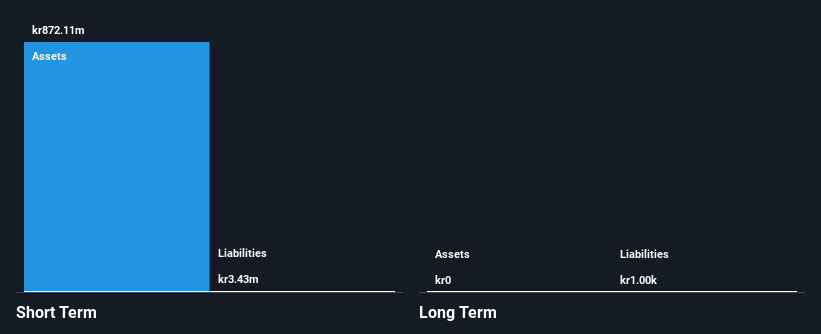
Saga Pure ASA, with a market cap of NOK620.64 million, has transitioned to profitability this year despite being pre-revenue with less than US$1 million in revenue. The company is debt-free and its short-term assets of NOK872.1 million comfortably cover both short-term and long-term liabilities. Recent earnings results show improvement; the net income for 2024 was NOK2.97 million compared to a significant loss the previous year, indicating financial progress. However, Return on Equity remains low at 0.3%. The board's seasoned experience adds stability amidst these developments, though management tenure details are unclear.
- Navigate through the intricacies of Saga Pure with our comprehensive balance sheet health report here.
- Understand Saga Pure's track record by examining our performance history report.
Summing It All Up
- Dive into all 435 of the European Penny Stocks we have identified here.
- Have a stake in these businesses? Integrate your holdings into Simply Wall St's portfolio for notifications and detailed stock reports.
- Simply Wall St is your key to unlocking global market trends, a free user-friendly app for forward-thinking investors.
Interested In Other Possibilities?
- Explore high-performing small cap companies that haven't yet garnered significant analyst attention.
- Jump on the AI train with fast growing tech companies forging a new era of innovation.
- Find companies with promising cash flow potential yet trading below their fair value.
This article by Simply Wall St is general in nature. We provide commentary based on historical data and analyst forecasts only using an unbiased methodology and our articles are not intended to be financial advice. It does not constitute a recommendation to buy or sell any stock, and does not take account of your objectives, or your financial situation. We aim to bring you long-term focused analysis driven by fundamental data. Note that our analysis may not factor in the latest price-sensitive company announcements or qualitative material. Simply Wall St has no position in any stocks mentioned.
New: AI Stock Screener & Alerts
Our new AI Stock Screener scans the market every day to uncover opportunities.
• Dividend Powerhouses (3%+ Yield)
• Undervalued Small Caps with Insider Buying
• High growth Tech and AI Companies
Or build your own from over 50 metrics.
Have feedback on this article? Concerned about the content? Get in touch with us directly. Alternatively, email editorial-team@simplywallst.com
About ENXTPA:ALUPG
UPERGY Société Anonyme
Manufactures and distributes batteries in France and internationally.
Adequate balance sheet slight.
Market Insights

Advertisement
Community Narratives
Pinterest will surge as advertising innovations ignite revenue growth
Fair Value US$42.63|27.0% undervalued
BR
Community Contributor
Brambles' Revenue Set to Climb 14% with Profit Margins Following
Fair Value AU$21.90|6.9% overvalued
RO
Community Contributor
Challenging Future for STG as Organic Sales Decline by 8.8%
Fair Value DKK 116.13|25.8% undervalued
KA
Community Contributor