Advertisement
Does Renault Offer Real Value After This Year’s 28.3% Stock Slide?

Simply Wall St
Reviewed by Bailey Pemberton
- Curious if Renault offers genuine value or is just another automaker on sale? This is the place to break down what the numbers are actually telling us about its stock.
- Renault's stock price has taken a sharp turn recently, dropping 8.5% over the past week and 28.3% year-to-date, signaling some big shifts in perception among investors.
- Much of this movement comes in the wake of speculation around industry partnerships and renewed focus on electric vehicle strategies. Recent headlines have also highlighted regulatory developments in the European auto sector, keeping Renault's future prospects in sharp focus.
- When we run Renault through our valuation checklist, it scores a solid 5 out of 6, suggesting it is undervalued by most measures. We will soon dig into how these valuations stack up, but keep an eye out, as there may be an even smarter way to judge Renault's appeal by the end of this article.
Find out why Renault's -12.8% return over the last year is lagging behind its peers.
Approach 1: Renault Discounted Cash Flow (DCF) Analysis
A Discounted Cash Flow (DCF) model estimates a company’s value by projecting its future cash flows and discounting them back to today. This reflects the idea that money now is worth more than money later. This approach provides a way to assess whether a stock is trading below, at, or above its intrinsic value based on these projections.
For Renault, analysts estimate a current Free Cash Flow (FCF) of around €844 Million. Over the next decade, cash flows are expected to grow, with projections reaching approximately €2.3 Billion by 2029. The first five years of these estimates are based on detailed analyst forecasts, with further growth extrapolated by Simply Wall St.
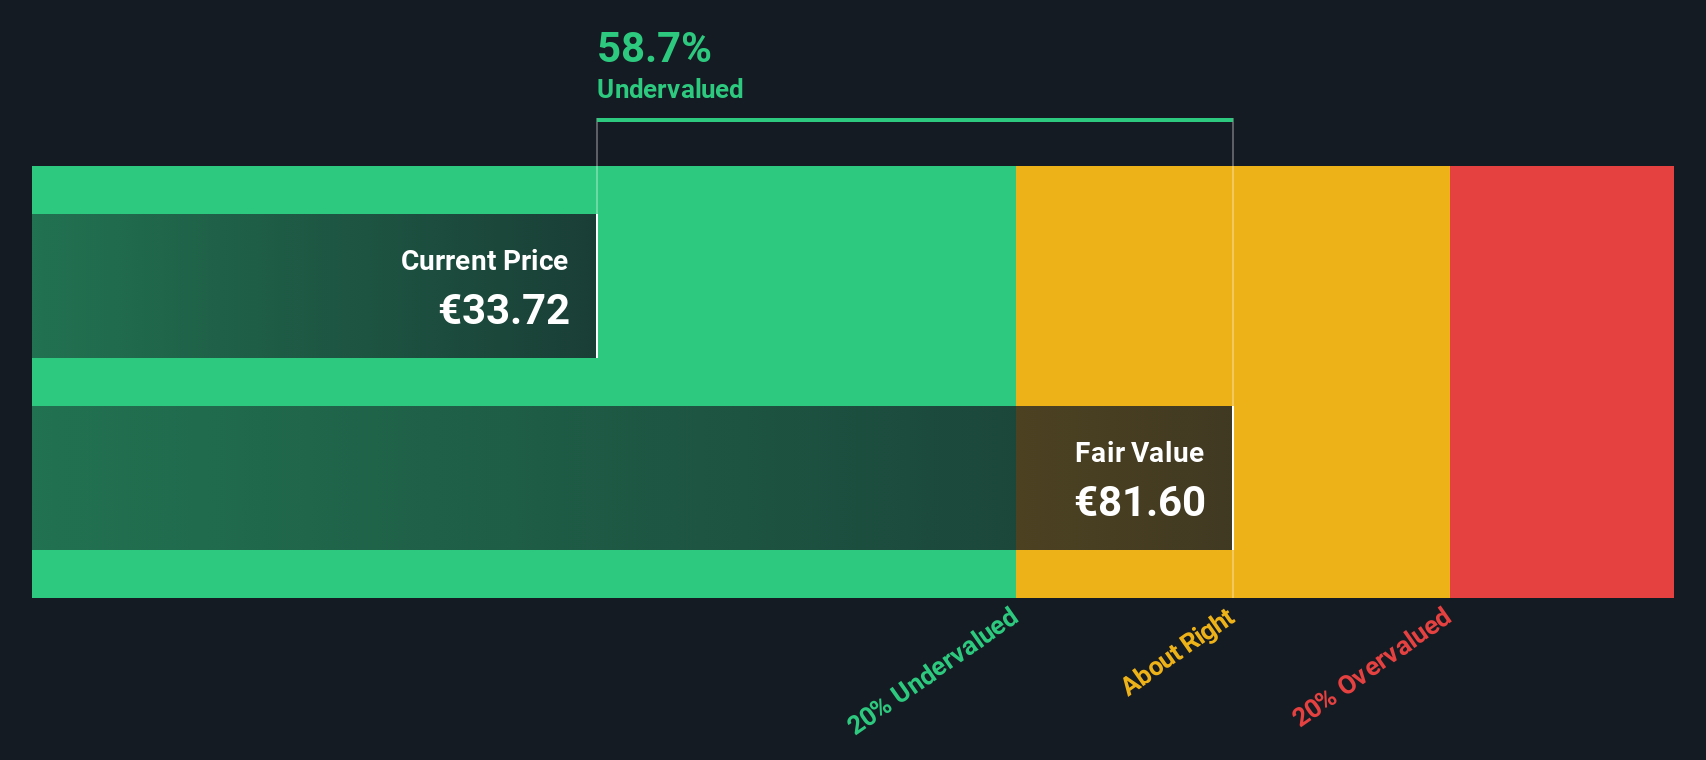
According to this two-stage FCF to equity DCF model, the fair value per share for Renault stands at €81.60. Compared to its current market price, this reveals a substantial intrinsic discount of 58.7 percent, implying the stock is significantly undervalued based on projected cash generation.
Result: UNDERVALUED
Our Discounted Cash Flow (DCF) analysis suggests Renault is undervalued by 58.7%. Track this in your watchlist or portfolio, or discover 918 more undervalued stocks based on cash flows.
Approach 2: Renault Price vs Sales
The Price-to-Sales (P/S) ratio is often the preferred valuation metric for companies where profitability may fluctuate, such as automakers facing industry transitions or investment cycles. By focusing on revenue rather than earnings, it provides a straightforward lens to gauge value without being skewed by short-term profit swings. This makes it especially suitable for Renault at this stage.
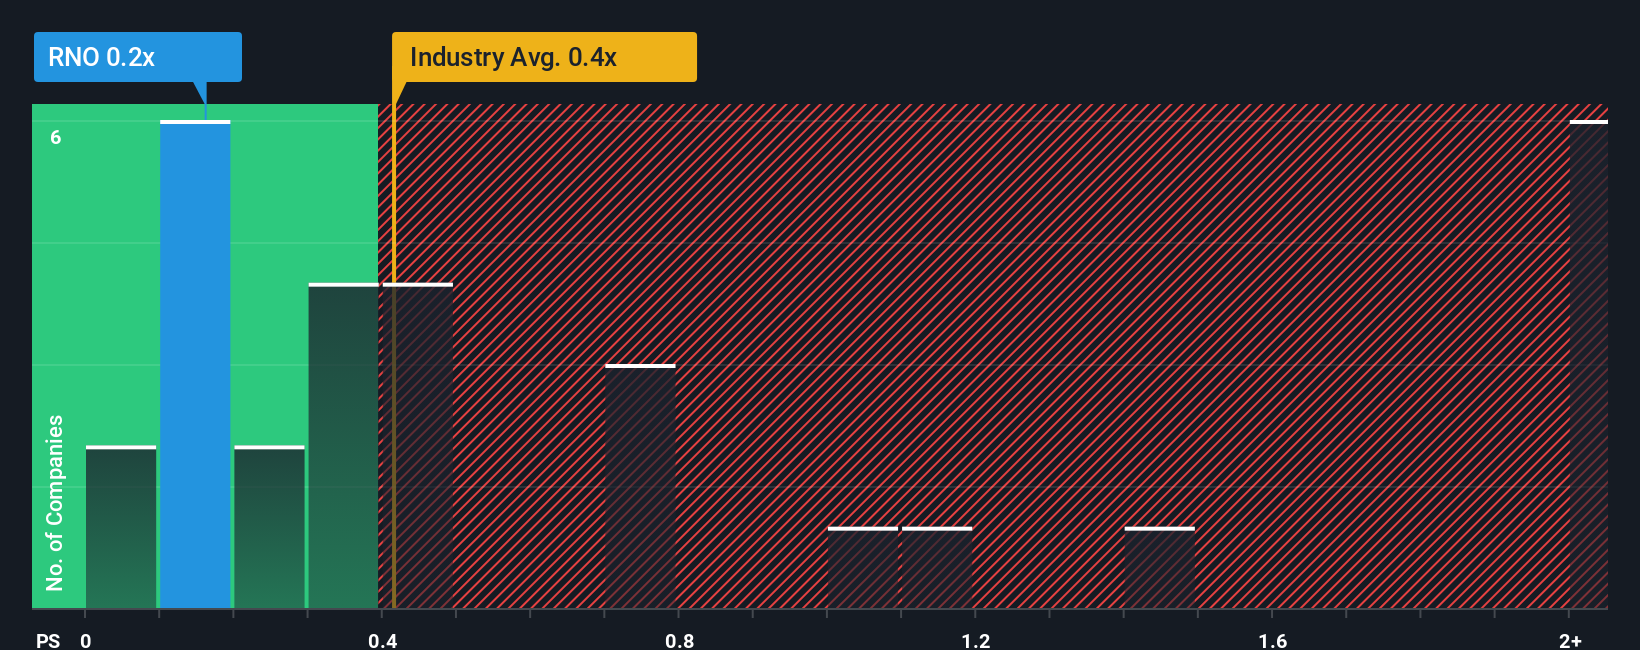
While a "normal" or "fair" P/S ratio should consider expectations for future growth and risks tied to the company's business model, it is common to compare a company's P/S to its peers and industry. Renault currently trades at a P/S ratio of 0.16x, which is significantly below both the Auto industry average of 0.78x and the peer average of 0.41x. These lower numbers may reflect market skepticism about Renault's growth prospects or profitability, but they also suggest a possible valuation gap.
Rather than just looking at industry or peer comparisons, Simply Wall St calculates a "Fair Ratio" as a proprietary benchmark for the preferred multiple that factors in Renault’s growth outlook, profit margins, risk profile, industry context, and market cap. This approach is more tailored, aiming to reflect what the market should realistically pay for Renault’s sales based on its unique characteristics, rather than relying only on generic group averages.
According to this Fair Ratio, Renault should trade at about 0.24x sales. With the actual P/S at 0.16x, the stock appears undervalued using this metric, suggesting the market may be underestimating Renault’s near-term prospects.
Result: UNDERVALUED
PS ratios tell one story, but what if the real opportunity lies elsewhere? Discover 1423 companies where insiders are betting big on explosive growth.
Upgrade Your Decision Making: Choose your Renault Narrative
Earlier we mentioned that there is an even better way to understand valuation, so let's introduce you to Narratives, a feature that helps you look beyond just numbers by connecting a company's story to its financial forecasts and ultimately, its fair value.
Simply put, a Narrative is your perspective on Renault, blending real-world developments and business strategy with your assumptions about future revenue, profit margins, and market conditions. Instead of relying solely on analyst forecasts, Narratives let you build or follow a story about Renault, then see how that story translates into projected earnings and fair value estimates.
This approach is easy and accessible for all investors and is used by millions within the Simply Wall St Community page. It empowers you to compare your Narrative’s fair value to Renault's current price, helping you make clear buy or sell decisions based on your own outlook, not just market consensus.
What makes Narratives especially powerful is that they update dynamically whenever new information arrives, like earnings or important news, so you always have the latest insights feeding your investment thesis.
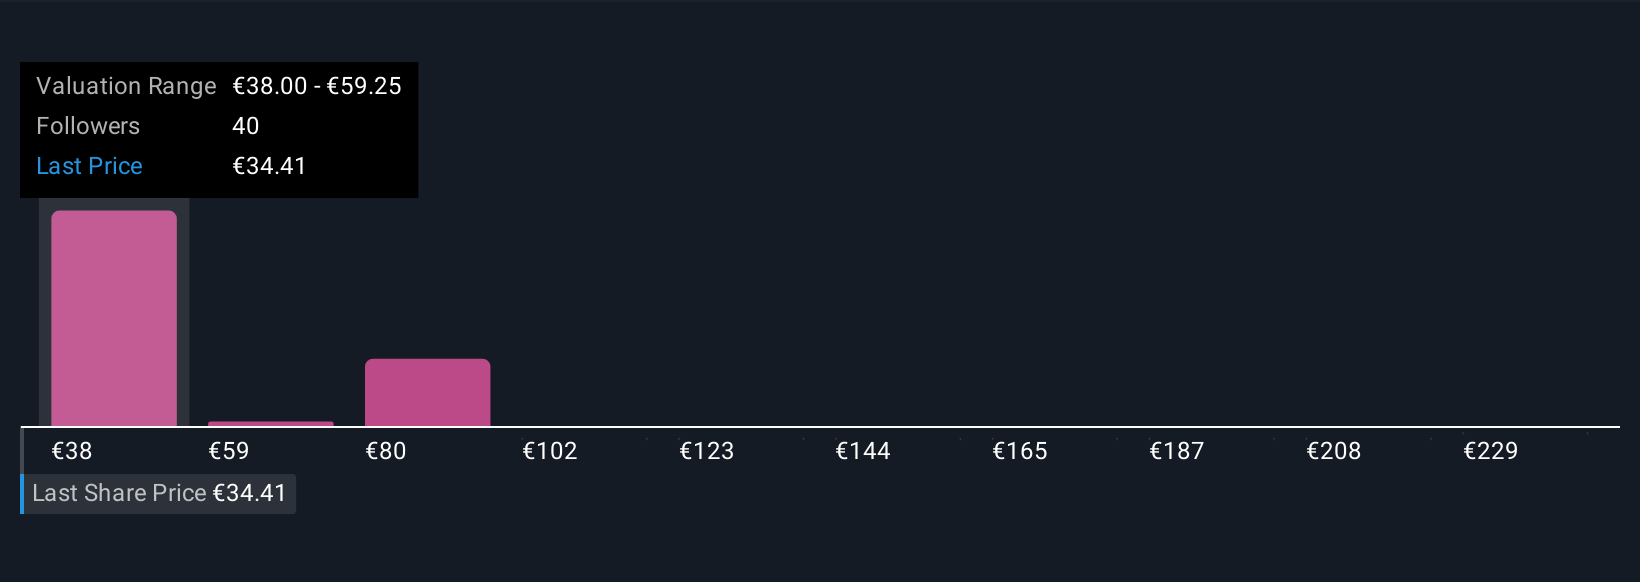
For example, with Renault, one Narrative might highlight strong EV launches and market resilience, supporting a fair value near €64 per share, while another could spotlight profitability risks in tough markets, resulting in a more cautious €38 per share estimate.
Do you think there's more to the story for Renault? Head over to our Community to see what others are saying!
This article by Simply Wall St is general in nature. We provide commentary based on historical data and analyst forecasts only using an unbiased methodology and our articles are not intended to be financial advice. It does not constitute a recommendation to buy or sell any stock, and does not take account of your objectives, or your financial situation. We aim to bring you long-term focused analysis driven by fundamental data. Note that our analysis may not factor in the latest price-sensitive company announcements or qualitative material. Simply Wall St has no position in any stocks mentioned.
New: AI Stock Screener & Alerts
Our new AI Stock Screener scans the market every day to uncover opportunities.
• Dividend Powerhouses (3%+ Yield)
• Undervalued Small Caps with Insider Buying
• High growth Tech and AI Companies
Or build your own from over 50 metrics.
Have feedback on this article? Concerned about the content? Get in touch with us directly. Alternatively, email editorial-team@simplywallst.com
About ENXTPA:RNO
Renault
Engages in the design, manufacture, sale, repair, maintenance, and leasing of motor vehicles in Europe, Eurasia, Africa, the Middle East, the Asia Pacific, and the Americas.
Undervalued average dividend payer.
Similar Companies
Market Insights

Advertisement
Community Narratives
MicroVision will explode future revenue by 380.37% with a vision towards success
Fair Value US$60.00|98.5% undervalued
TH
Community Contributor
The Indispensable Artery for a New North American Economy
Fair Value CA$132.87|2.3% undervalued
TI
Community Contributor