
Advertisement
Today we'll take a closer look at Fortum Oyj (HEL:FORTUM) from a dividend investor's perspective. Owning a strong business and reinvesting the dividends is widely seen as an attractive way of growing your wealth. Yet sometimes, investors buy a stock for its dividend and lose money because the share price falls by more than they earned in dividend payments.
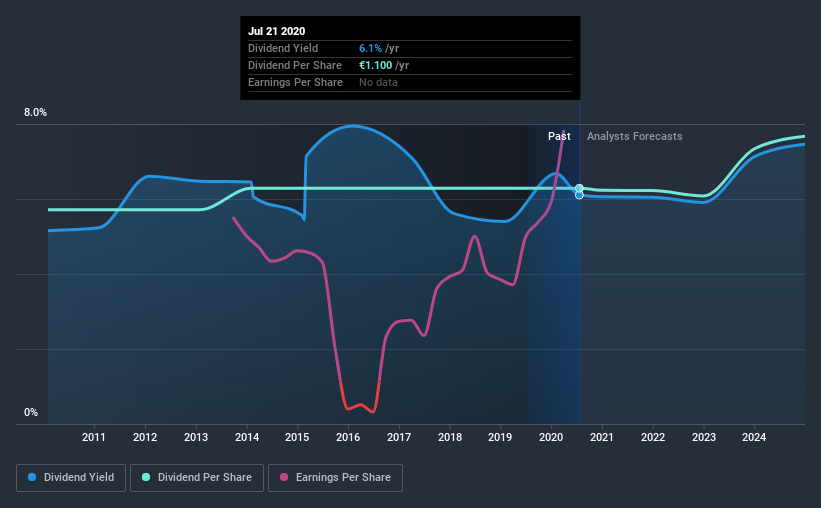
With Fortum Oyj yielding 6.1% and having paid a dividend for over 10 years, many investors likely find the company quite interesting. It would not be a surprise to discover that many investors buy it for the dividends. There are a few simple ways to reduce the risks of buying Fortum Oyj for its dividend, and we'll go through these below.
Explore this interactive chart for our latest analysis on Fortum Oyj!
Payout ratios
Companies (usually) pay dividends out of their earnings. If a company is paying more than it earns, the dividend might have to be cut. Comparing dividend payments to a company's net profit after tax is a simple way of reality-checking whether a dividend is sustainable. In the last year, Fortum Oyj paid out 47% of its profit as dividends. This is a medium payout level that leaves enough capital in the business to fund opportunities that might arise, while also rewarding shareholders. Plus, there is room to increase the payout ratio over time.
In addition to comparing dividends against profits, we should inspect whether the company generated enough cash to pay its dividend. Fortum Oyj paid out 57% of its cash flow as dividends last year, which is within a reasonable range for the average corporation. It's positive to see that Fortum Oyj's dividend is covered by both profits and cash flow, since this is generally a sign that the dividend is sustainable, and a lower payout ratio usually suggests a greater margin of safety before the dividend gets cut.
Is Fortum Oyj's Balance Sheet Risky?
As Fortum Oyj has a meaningful amount of debt, we need to check its balance sheet to see if the company might have debt risks. A rough way to check this is with these two simple ratios: a) net debt divided by EBITDA (earnings before interest, tax, depreciation and amortisation), and b) net interest cover. Net debt to EBITDA is a measure of a company's total debt. Net interest cover measures the ability to meet interest payments. Essentially we check that a) the company does not have too much debt, and b) that it can afford to pay the interest. With net debt of 2.98 times its EBITDA, Fortum Oyj's debt burden is within a normal range for most listed companies.
We calculated its interest cover by measuring its earnings before interest and tax (EBIT), and dividing this by the company's net interest expense. Fortum Oyj has EBIT of 8.91 times its interest expense, which we think is adequate.
Consider getting our latest analysis on Fortum Oyj's financial position here.
Dividend Volatility
Before buying a stock for its income, we want to see if the dividends have been stable in the past, and if the company has a track record of maintaining its dividend. Fortum Oyj has been paying dividends for a long time, but for the purpose of this analysis, we only examine the past 10 years of payments. The dividend has been stable over the past 10 years, which is great. We think this could suggest some resilience to the business and its dividends. During the past ten-year period, the first annual payment was €1.0 in 2010, compared to €1.1 last year. Dividend payments have grown at less than 1% a year over this period.
Dividends have grown relatively slowly, which is not great, but some investors may value the relative consistency of the dividend.
Dividend Growth Potential
While dividend payments have been relatively reliable, it would also be nice if earnings per share (EPS) were growing, as this is essential to maintaining the dividend's purchasing power over the long term. It's good to see Fortum Oyj has been growing its earnings per share at 14% a year over the past five years. Earnings per share have been growing at a good rate, and the company is paying less than half its earnings as dividends. We generally think this is an attractive combination, as it permits further reinvestment in the business.
Conclusion
When we look at a dividend stock, we need to form a judgement on whether the dividend will grow, if the company is able to maintain it in a wide range of economic circumstances, and if the dividend payout is sustainable. Firstly, we like that Fortum Oyj pays out a low fraction of earnings. It pays out a higher percentage of its cashflow, although this is within acceptable bounds. Next, growing earnings per share and steady dividend payments is a great combination. Overall we think Fortum Oyj scores well on our analysis. It's not quite perfect, but we'd definitely be keen to take a closer look.
Market movements attest to how highly valued a consistent dividend policy is compared to one which is more unpredictable. Meanwhile, despite the importance of dividend payments, they are not the only factors our readers should know when assessing a company. Case in point: We've spotted 2 warning signs for Fortum Oyj (of which 1 is a bit concerning!) you should know about.
If you are a dividend investor, you might also want to look at our curated list of dividend stocks yielding above 3%.
If you’re looking to trade Fortum Oyj, open an account with the lowest-cost* platform trusted by professionals, Interactive Brokers. Their clients from over 200 countries and territories trade stocks, options, futures, forex, bonds and funds worldwide from a single integrated account. Promoted
New: AI Stock Screener & Alerts
Our new AI Stock Screener scans the market every day to uncover opportunities.
• Dividend Powerhouses (3%+ Yield)
• Undervalued Small Caps with Insider Buying
• High growth Tech and AI Companies
Or build your own from over 50 metrics.
This article by Simply Wall St is general in nature. It does not constitute a recommendation to buy or sell any stock, and does not take account of your objectives, or your financial situation. We aim to bring you long-term focused analysis driven by fundamental data. Note that our analysis may not factor in the latest price-sensitive company announcements or qualitative material. Simply Wall St has no position in any stocks mentioned.
*Interactive Brokers Rated Lowest Cost Broker by StockBrokers.com Annual Online Review 2020
Have feedback on this article? Concerned about the content? Get in touch with us directly. Alternatively, email editorial-team@simplywallst.com.
About HLSE:FORTUM
Fortum Oyj
Engages in the generation and sale of electricity and heat in Finland, Sweden, the Netherlands, Ireland, Denmark, Belgium, the United Kingdom, Switzerland, Spain, France, Germany, Norway, and internationally.
Excellent balance sheet and fair value.
Similar Companies
Market Insights

Advertisement
Community Narratives
Kodiak AI - a potential 100 bagger opportunity?
Fair Value US$14.00|41.9% undervalued
DA
Community Contributor
A Fair Price for a Great Business Facing Real Threats
Fair Value US$383.06|13.0% undervalued
IM
Community Contributor
AXON And Shopify Integration Will Unlock Global Mobile Advertising
Fair Value US$613.59|2.3% undervalued
AN
Based on Analyst Price Targets