
Advertisement
Thinking about what to do with Orion Oyj stock? You are not alone. After a year of eye-catching returns and a track record that stretches back with steady gains, this Finnish pharmaceutical company is catching more attention than ever. If you have been following Orion for a while, you might have noticed its resilience even during market jitters; the stock climbed 49.7% year to date and boasts a 91.0% gain over the past five years. Short-term numbers also show strength, with a 2.4% lift in the past week, even as the last month was a touch softer at -0.9%.
Some of this confidence comes from optimistic outlooks on pharmaceutical demand and broad market sentiment favoring defensive health care names. Growth potential or changing risk perceptions are clearly at play. Still, investors looking for pure value signals will want more than just momentum.
One way to cut through the noise is by weighing Orion Oyj’s valuation score. In a framework where six key checks are considered, Orion passed two, making for a valuation score of 2 out of 6. That means there are pockets of value, but also areas that might look a bit stretched.
But are these traditional checks telling the whole story? Next, let’s break down how those valuation methods really work, and later, I will let you in on an even more insightful approach to thinking about Orion Oyj’s true worth.
Orion Oyj scores just 2/6 on our valuation checks. See what other red flags we found in the full valuation breakdown.
Approach 1: Orion Oyj Discounted Cash Flow (DCF) Analysis
A Discounted Cash Flow (DCF) model estimates a company’s intrinsic value by projecting its future cash flows and discounting them back to today’s value in euros. This approach tries to capture the core worth of the business by focusing on how much cash it is likely to generate over time.
For Orion Oyj, the DCF model starts with the latest reported Free Cash Flow, standing at €199.7 million. Analysts forecast steady growth, projecting annual Free Cash Flows to rise to €564.8 million by the end of 2029. While direct analyst estimates reach five years into the future, further projections are derived using a moderate growth rate for the years that follow.
After discounting all these projected cash flows using a 2-stage Free Cash Flow to Equity method, Orion Oyj’s estimated intrinsic value per share is €113.70. This figure sits 42.6% above the current share price, suggesting the stock trades at a significant discount to its underlying cash flow value.
Result: UNDERVALUED
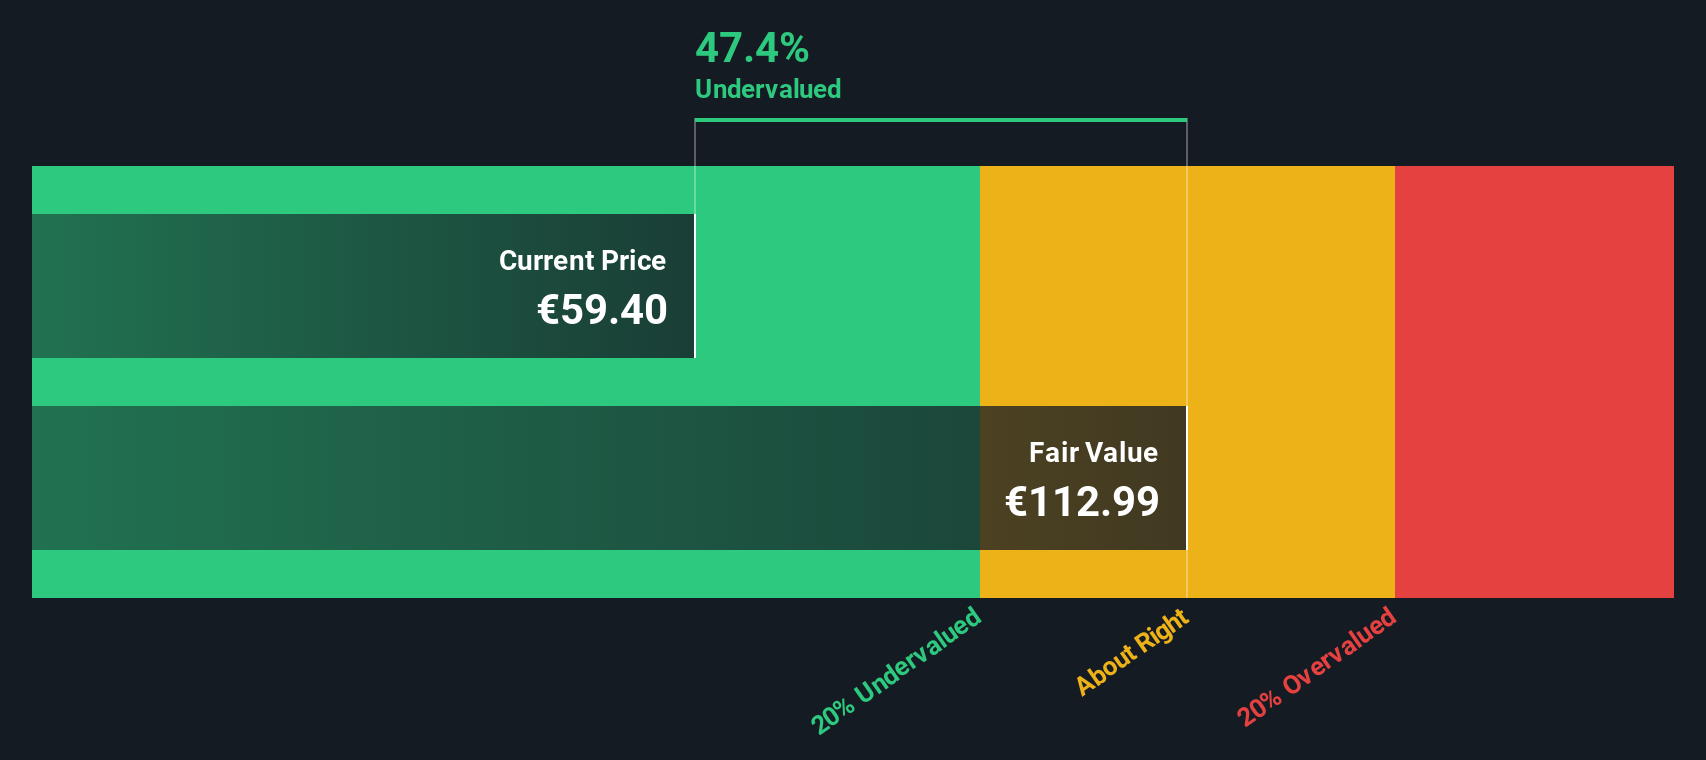
Our Discounted Cash Flow (DCF) analysis suggests Orion Oyj is undervalued by 42.6%. Track this in your watchlist or portfolio, or discover more undervalued stocks.
Approach 2: Orion Oyj Price vs Earnings
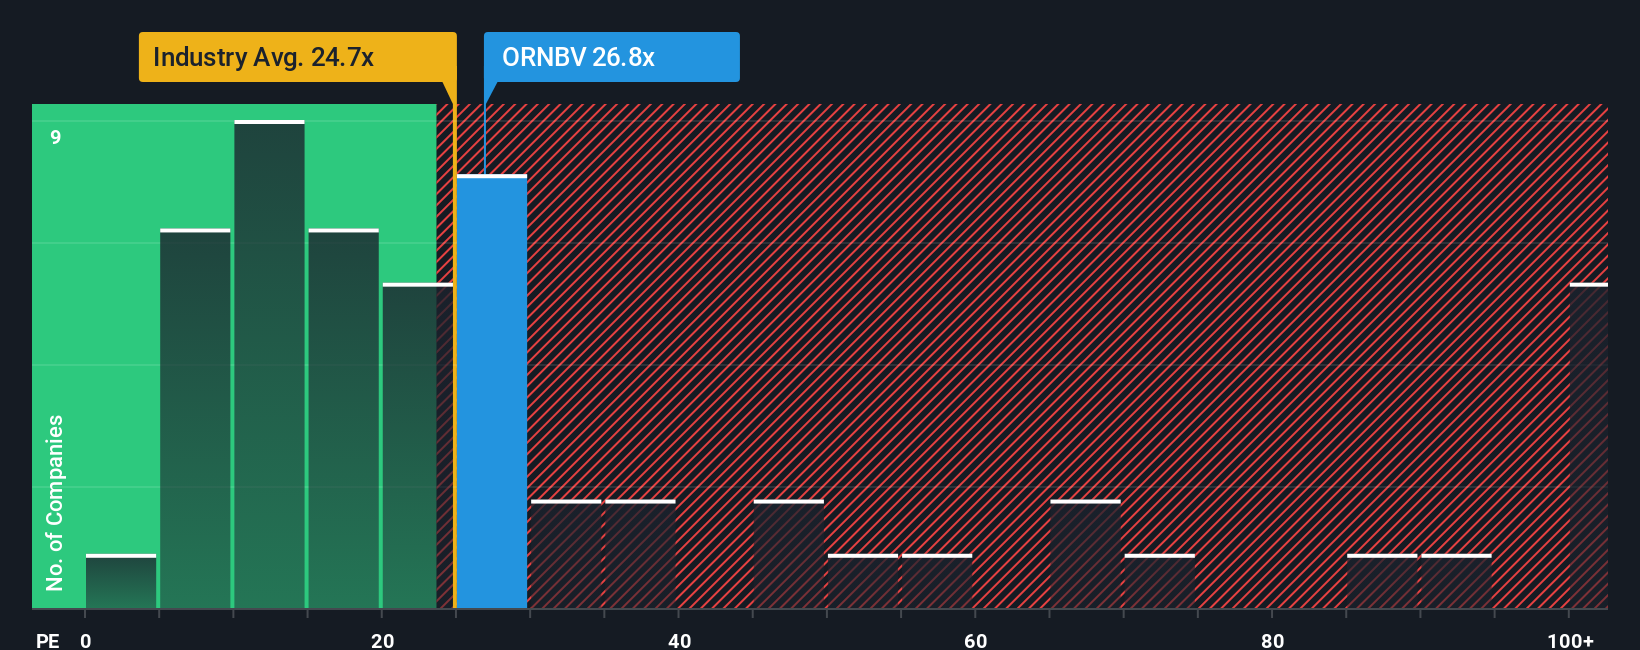
The Price-to-Earnings (PE) ratio is a widely used metric for valuing profitable companies like Orion Oyj. It is especially relevant for firms with steady earnings, as it reflects how much investors are willing to pay for each euro of current profit. Higher expected growth or lower perceived risks tend to justify a higher PE ratio. In contrast, slow growth or elevated risks generally push the fair multiple lower.
Orion Oyj is currently trading at a PE ratio of 24.3x. This is just below the Pharmaceuticals industry average of 24.7x and slightly above the peer average of 21.4x. Although traditional comparisons to industry and peers provide useful context, they do not always account for unique factors impacting a specific company.
This is where Simply Wall St’s proprietary “Fair Ratio” comes in. Unlike standard benchmarks, the Fair Ratio considers Orion’s earnings growth outlook, profit margins, risk profile, industry trends, and company size to arrive at a more tailored number. This helps investors evaluate whether the current valuation is justified not just by comparison, but by the actual quality and prospects of Orion Oyj.
With the current PE ratio hovering very close to its Fair Ratio, the market appears to have priced Orion Oyj about right on this metric.
Result: ABOUT RIGHT
PE ratios tell one story, but what if the real opportunity lies elsewhere? Discover companies where insiders are betting big on explosive growth.
Upgrade Your Decision Making: Choose your Orion Oyj Narrative
Earlier we mentioned that there is an even better way to understand valuation. Let us introduce you to Narratives. A Narrative is simply your perspective or story about a company. It connects your own assumptions for Orion Oyj’s future growth, earnings, and margins to a tailored financial forecast and fair value. Rather than relying purely on past numbers, Narratives allow you to bring together the big picture, using both data and your unique insights.
This powerful tool, available in the Community page on Simply Wall St and used by millions of investors, makes valuation both personal and dynamic. With Narratives, you can see how your view stacks up against others and quickly compare your fair value estimate for Orion Oyj to the current share price, making it easier to decide when to buy or sell.
Best of all, Narratives update automatically as new information, such as earnings releases or news, becomes available, ensuring your analysis stays relevant. For example, some investors might see Orion’s fair value as high as €135 per share, while others assign a more conservative figure closer to €85, reflecting different outlooks and risk tolerances. Narratives put your investment decisions into context, giving you the confidence to act on your own story.
Do you think there's more to the story for Orion Oyj? Create your own Narrative to let the Community know!

This article by Simply Wall St is general in nature. We provide commentary based on historical data and analyst forecasts only using an unbiased methodology and our articles are not intended to be financial advice. It does not constitute a recommendation to buy or sell any stock, and does not take account of your objectives, or your financial situation. We aim to bring you long-term focused analysis driven by fundamental data. Note that our analysis may not factor in the latest price-sensitive company announcements or qualitative material. Simply Wall St has no position in any stocks mentioned.
New: AI Stock Screener & Alerts
Our new AI Stock Screener scans the market every day to uncover opportunities.
• Dividend Powerhouses (3%+ Yield)
• Undervalued Small Caps with Insider Buying
• High growth Tech and AI Companies
Or build your own from over 50 metrics.
Have feedback on this article? Concerned about the content? Get in touch with us directly. Alternatively, email editorial-team@simplywallst.com
About HLSE:ORNBV
Orion Oyj
Develops, manufactures, and markets human and veterinary pharmaceuticals and active pharmaceutical ingredients (APIs) in Finland, Scandinavia, rest of Europe, North America, and internationally.
Excellent balance sheet average dividend payer.
Similar Companies
Market Insights

Advertisement
Community Narratives
MicroVision will explode future revenue by 380.37% with a vision towards success
Fair Value US$60|98.4% undervalued
TH
Community Contributor
The Indispensable Artery for a New North American Economy
Fair Value CA$132.87|0.7% overvalued
TI
Community Contributor
Recently Updated Narratives
CO

composite32 on Astor Enerji ·
Astor Enerji will surge with a fair value of $140.43 in the next 3 years
Fair Value:₺140.4335.5% undervalued
1 followerusers have followed this narrative
0 commentsusers have commented on this narrative
0 likesusers have liked this narrative
RE

RecMag on Proximus ·
Proximus: The State-Backed Backup Plan with 7% Gross Yield and 15% Currency Upside.
Fair Value:€17.1356.7% undervalued
29 followersusers have followed this narrative
0 commentsusers have commented on this narrative
0 likesusers have liked this narrative
AG


Agricola on IMPACT Silver ·
A case for for IMPACT Silver Corp (TSXV:IPT) to reach USD $4.52 (CAD $6.16) in 2026 (23 bagger in 1 year) and USD $5.76 (CAD $7.89) by 2030
Fair Value:CA$7.8996.2% undervalued
1 followerusers have followed this narrative
0 commentsusers have commented on this narrative
0 likesusers have liked this narrative
Popular Narratives
TH

TheWallstreetKing on MicroVision ·
MicroVision will explode future revenue by 380.37% with a vision towards success
Fair Value:US$6098.4% undervalued
101 followersusers have followed this narrative
10 commentsusers have commented on this narrative
20 likesusers have liked this narrative
OS


oscargarcia on Alphabet ·
The company that turned a verb into a global necessity and basically runs the modern internet, digital ads, smartphones, maps, and AI.
Fair Value:US$3405.8% undervalued
137 followersusers have followed this narrative
6 commentsusers have commented on this narrative
18 likesusers have liked this narrative
AN


AnalystConsensusTarget on NVIDIA ·
NVDA: Expanding AI Demand Will Drive Major Data Center Investments Through 2026
Fair Value:US$250.3929.3% undervalued
929 followersusers have followed this narrative
6 commentsusers have commented on this narrative
23 likesusers have liked this narrative