- Finland
- /
- Professional Services
- /
- HLSE:TNOM
The Price Is Right For Talenom Oyj (HEL:TNOM) Even After Diving 25%

Talenom Oyj (HEL:TNOM) shares have had a horrible month, losing 25% after a relatively good period beforehand. The drop over the last 30 days has capped off a tough year for shareholders, with the share price down 23% in that time.
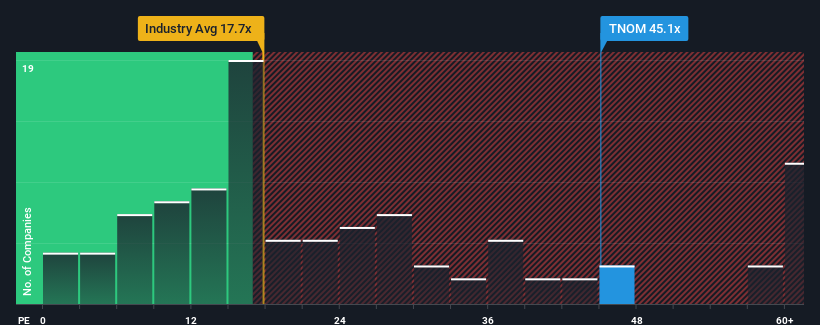
In spite of the heavy fall in price, Talenom Oyj's price-to-earnings (or "P/E") ratio of 45.1x might still make it look like a strong sell right now compared to the market in Finland, where around half of the companies have P/E ratios below 18x and even P/E's below 13x are quite common. However, the P/E might be quite high for a reason and it requires further investigation to determine if it's justified.
With earnings that are retreating more than the market's of late, Talenom Oyj has been very sluggish. One possibility is that the P/E is high because investors think the company will turn things around completely and accelerate past most others in the market. You'd really hope so, otherwise you're paying a pretty hefty price for no particular reason.
See our latest analysis for Talenom Oyj

What Are Growth Metrics Telling Us About The High P/E?
There's an inherent assumption that a company should far outperform the market for P/E ratios like Talenom Oyj's to be considered reasonable.
Retrospectively, the last year delivered a frustrating 54% decrease to the company's bottom line. As a result, earnings from three years ago have also fallen 65% overall. Therefore, it's fair to say the earnings growth recently has been undesirable for the company.
Turning to the outlook, the next three years should generate growth of 66% per annum as estimated by the three analysts watching the company. Meanwhile, the rest of the market is forecast to only expand by 15% per year, which is noticeably less attractive.
With this information, we can see why Talenom Oyj is trading at such a high P/E compared to the market. It seems most investors are expecting this strong future growth and are willing to pay more for the stock.
The Final Word
A significant share price dive has done very little to deflate Talenom Oyj's very lofty P/E. Typically, we'd caution against reading too much into price-to-earnings ratios when settling on investment decisions, though it can reveal plenty about what other market participants think about the company.
We've established that Talenom Oyj maintains its high P/E on the strength of its forecast growth being higher than the wider market, as expected. At this stage investors feel the potential for a deterioration in earnings isn't great enough to justify a lower P/E ratio. It's hard to see the share price falling strongly in the near future under these circumstances.
You need to take note of risks, for example - Talenom Oyj has 4 warning signs (and 1 which can't be ignored) we think you should know about.
If P/E ratios interest you, you may wish to see this free collection of other companies with strong earnings growth and low P/E ratios.
Valuation is complex, but we're here to simplify it.
Discover if Talenom Oyj might be undervalued or overvalued with our detailed analysis, featuring fair value estimates, potential risks, dividends, insider trades, and its financial condition.
Access Free AnalysisHave feedback on this article? Concerned about the content? Get in touch with us directly. Alternatively, email editorial-team (at) simplywallst.com.
This article by Simply Wall St is general in nature. We provide commentary based on historical data and analyst forecasts only using an unbiased methodology and our articles are not intended to be financial advice. It does not constitute a recommendation to buy or sell any stock, and does not take account of your objectives, or your financial situation. We aim to bring you long-term focused analysis driven by fundamental data. Note that our analysis may not factor in the latest price-sensitive company announcements or qualitative material. Simply Wall St has no position in any stocks mentioned.
About HLSE:TNOM
Talenom Oyj
Provides accounting and other services for small and medium-sized enterprises in Finland, Sweden, Spain, and Italy.
Good value with reasonable growth potential.


