
Advertisement
Is Grifols, S.A. (BME:GRF) Expensive For A Reason? A Look At Its Intrinsic Value
Key Insights
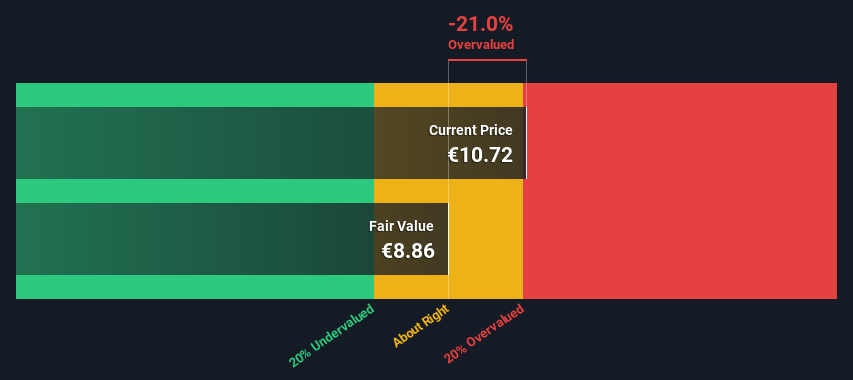
- The projected fair value for Grifols is €8.86 based on 2 Stage Free Cash Flow to Equity
- Current share price of €10.72 suggests Grifols is potentially 21% overvalued
- Analyst price target for GRF is €18.52, which is 109% above our fair value estimate
Today we will run through one way of estimating the intrinsic value of Grifols, S.A. (BME:GRF) by taking the expected future cash flows and discounting them to today's value. One way to achieve this is by employing the Discounted Cash Flow (DCF) model. It may sound complicated, but actually it is quite simple!
Companies can be valued in a lot of ways, so we would point out that a DCF is not perfect for every situation. If you still have some burning questions about this type of valuation, take a look at the Simply Wall St analysis model.
Check out our latest analysis for Grifols
Step By Step Through The Calculation
We're using the 2-stage growth model, which simply means we take in account two stages of company's growth. In the initial period the company may have a higher growth rate and the second stage is usually assumed to have a stable growth rate. To begin with, we have to get estimates of the next ten years of cash flows. Where possible we use analyst estimates, but when these aren't available we extrapolate the previous free cash flow (FCF) from the last estimate or reported value. We assume companies with shrinking free cash flow will slow their rate of shrinkage, and that companies with growing free cash flow will see their growth rate slow, over this period. We do this to reflect that growth tends to slow more in the early years than it does in later years.
Generally we assume that a dollar today is more valuable than a dollar in the future, and so the sum of these future cash flows is then discounted to today's value:
10-year free cash flow (FCF) estimate
| 2024 | 2025 | 2026 | 2027 | 2028 | 2029 | 2030 | 2031 | 2032 | 2033 | |
| Levered FCF (€, Millions) | €774.2m | €924.8m | €1.13b | €780.3m | €599.3m | €504.2m | €450.1m | €417.9m | €398.6m | €387.1m |
| Growth Rate Estimate Source | Analyst x8 | Analyst x6 | Analyst x4 | Analyst x1 | Est @ -23.19% | Est @ -15.86% | Est @ -10.74% | Est @ -7.15% | Est @ -4.63% | Est @ -2.87% |
| Present Value (€, Millions) Discounted @ 9.9% | €704 | €765 | €850 | €534 | €373 | €286 | €232 | €196 | €170 | €150 |
("Est" = FCF growth rate estimated by Simply Wall St)
Present Value of 10-year Cash Flow (PVCF) = €4.3b
After calculating the present value of future cash flows in the initial 10-year period, we need to calculate the Terminal Value, which accounts for all future cash flows beyond the first stage. For a number of reasons a very conservative growth rate is used that cannot exceed that of a country's GDP growth. In this case we have used the 5-year average of the 10-year government bond yield (1.2%) to estimate future growth. In the same way as with the 10-year 'growth' period, we discount future cash flows to today's value, using a cost of equity of 9.9%.
Terminal Value (TV)= FCF2033 × (1 + g) ÷ (r – g) = €387m× (1 + 1.2%) ÷ (9.9%– 1.2%) = €4.5b
Present Value of Terminal Value (PVTV)= TV / (1 + r)10= €4.5b÷ ( 1 + 9.9%)10= €1.7b
The total value is the sum of cash flows for the next ten years plus the discounted terminal value, which results in the Total Equity Value, which in this case is €6.0b. The last step is to then divide the equity value by the number of shares outstanding. Relative to the current share price of €10.7, the company appears slightly overvalued at the time of writing. Remember though, that this is just an approximate valuation, and like any complex formula - garbage in, garbage out.
Important Assumptions
We would point out that the most important inputs to a discounted cash flow are the discount rate and of course the actual cash flows. If you don't agree with these result, have a go at the calculation yourself and play with the assumptions. The DCF also does not consider the possible cyclicality of an industry, or a company's future capital requirements, so it does not give a full picture of a company's potential performance. Given that we are looking at Grifols as potential shareholders, the cost of equity is used as the discount rate, rather than the cost of capital (or weighted average cost of capital, WACC) which accounts for debt. In this calculation we've used 9.9%, which is based on a levered beta of 1.170. Beta is a measure of a stock's volatility, compared to the market as a whole. We get our beta from the industry average beta of globally comparable companies, with an imposed limit between 0.8 and 2.0, which is a reasonable range for a stable business.
SWOT Analysis for Grifols
Strength
- Debt is well covered by .
Weakness
- Earnings declined over the past year.
- Interest payments on debt are not well covered.
Opportunity
- Annual earnings are forecast to grow faster than the Spanish market.
- Good value based on P/S ratio compared to estimated Fair P/S ratio.
Threat
- Debt is not well covered by operating cash flow.
- Revenue is forecast to grow slower than 20% per year.
Looking Ahead:
Although the valuation of a company is important, it shouldn't be the only metric you look at when researching a company. DCF models are not the be-all and end-all of investment valuation. Instead the best use for a DCF model is to test certain assumptions and theories to see if they would lead to the company being undervalued or overvalued. For example, changes in the company's cost of equity or the risk free rate can significantly impact the valuation. Why is the intrinsic value lower than the current share price? For Grifols, there are three additional aspects you should further research:
- Risks: Case in point, we've spotted 3 warning signs for Grifols you should be aware of, and 1 of them is potentially serious.
- Future Earnings: How does GRF's growth rate compare to its peers and the wider market? Dig deeper into the analyst consensus number for the upcoming years by interacting with our free analyst growth expectation chart.
- Other Solid Businesses: Low debt, high returns on equity and good past performance are fundamental to a strong business. Why not explore our interactive list of stocks with solid business fundamentals to see if there are other companies you may not have considered!
PS. The Simply Wall St app conducts a discounted cash flow valuation for every stock on the BME every day. If you want to find the calculation for other stocks just search here.
New: Manage All Your Stock Portfolios in One Place
We've created the ultimate portfolio companion for stock investors, and it's free.
• Connect an unlimited number of Portfolios and see your total in one currency
• Be alerted to new Warning Signs or Risks via email or mobile
• Track the Fair Value of your stocks
Have feedback on this article? Concerned about the content? Get in touch with us directly. Alternatively, email editorial-team (at) simplywallst.com.
This article by Simply Wall St is general in nature. We provide commentary based on historical data and analyst forecasts only using an unbiased methodology and our articles are not intended to be financial advice. It does not constitute a recommendation to buy or sell any stock, and does not take account of your objectives, or your financial situation. We aim to bring you long-term focused analysis driven by fundamental data. Note that our analysis may not factor in the latest price-sensitive company announcements or qualitative material. Simply Wall St has no position in any stocks mentioned.
About BME:GRF
Grifols
Operates as a plasma therapeutic company in Spain, the United States, Canada, and internationally.
Excellent balance sheet and good value.
Similar Companies
Market Insights

Advertisement
Weekly Picks
WO

woodworthfund on MGP Ingredients ·
THE KINGDOM OF BROWN GOODS: WHY MGPI IS BEING CRUSHED BY INVENTORY & PRIMED FOR RESURRECTION
Fair Value:US$4034.1% undervalued
18 followersusers have followed this narrative
1 commentusers have commented on this narrative
4 likesusers have liked this narrative
DO


Double_Bubbler on Vertical Aerospace ·
Why Vertical Aerospace (NYSE: EVTL) is Worth Possibly Over 13x its Current Price
Fair Value:US$6090.0% undervalued
21 followersusers have followed this narrative
2 commentsusers have commented on this narrative
17 likesusers have liked this narrative
TI


TickerTickle on Oracle ·
The Quiet Giant That Became AI’s Power Grid
Fair Value:US$389.8142.8% undervalued
41 followersusers have followed this narrative
3 commentsusers have commented on this narrative
8 likesusers have liked this narrative
Recently Updated Narratives
MH


mhbb on Mastersystem Infotama ·
Mastersystem Infotama will achieve 18.9% revenue growth as fair value hits IDR1,650
Fair Value:Rp1.63k13.8% undervalued
1 followerusers have followed this narrative
0 commentsusers have commented on this narrative
0 likesusers have liked this narrative
RO


Robbo on Procter & Gamble ·
Insiders Sell, Investors Watch: What’s Going On at PG?
Fair Value:US$1506.8% undervalued
1 followerusers have followed this narrative
0 commentsusers have commented on this narrative
0 likesusers have liked this narrative
CW

Cwburton on Verano Holdings ·
Waiting for the Inevitable
Fair Value:CA$5.5278.8% undervalued
2 followersusers have followed this narrative
0 commentsusers have commented on this narrative
0 likesusers have liked this narrative
Popular Narratives
TH


TheWallstreetKing on MicroVision ·
MicroVision will explode future revenue by 380.37% with a vision towards success
Fair Value:US$6098.5% undervalued
119 followersusers have followed this narrative
11 commentsusers have commented on this narrative
22 likesusers have liked this narrative
AN


AnalystConsensusTarget on NVIDIA ·
NVDA: Expanding AI Demand Will Drive Major Data Center Investments Through 2026
Fair Value:US$250.3926.6% undervalued
962 followersusers have followed this narrative
6 commentsusers have commented on this narrative
25 likesusers have liked this narrative
RO


RockeTeller on Santacruz Silver Mining ·
Crazy Undervalued 42 Baggers Silver Play (Active & Running Mine)
Fair Value:CA$8684.3% undervalued
77 followersusers have followed this narrative
8 commentsusers have commented on this narrative
21 likesusers have liked this narrative
Trending Discussion

OI


OilStates on Oil States International ·
The article’s takeaways do not reflect Oil States’ current business mix or market realities. Nearly 75% of Company revenues now come from offshore and international projects, where industry investment is strengthening, not declining, and backlog is at the highest level in a decade. Oil States has intentionally exited lower-margin U.S. land markets, resulting in expanding margins, strong free cash flow, and a near-zero net-debt profile. Our offerings are concentrated in high-barrier, engineered offshore technologies where competitive pressure and regulatory risk are far lower than implied. These fundamentals therefore do not align with the structural-decline narrative presented. Find out more about the strong offshore/international, cash generation, and valuation upside potential in our latest investor presentation available here: https://ir.oilstatesintl.com/events-and-presentations/default.aspx
0
|0