
Advertisement
- Spain
- /
- Metals and Mining
- /
- BME:ACX
Should Weakness in Acerinox, S.A.'s (BME:ACX) Stock Be Seen As A Sign That Market Will Correct The Share Price Given Decent Financials?

With its stock down 8.4% over the past three months, it is easy to disregard Acerinox (BME:ACX). However, the company's fundamentals look pretty decent, and long-term financials are usually aligned with future market price movements. In this article, we decided to focus on Acerinox's ROE.
Return on equity or ROE is a key measure used to assess how efficiently a company's management is utilizing the company's capital. Put another way, it reveals the company's success at turning shareholder investments into profits.
Check out our latest analysis for Acerinox
How Is ROE Calculated?
ROE can be calculated by using the formula:
Return on Equity = Net Profit (from continuing operations) ÷ Shareholders' Equity
So, based on the above formula, the ROE for Acerinox is:
2.0% = €51m ÷ €2.6b (Based on the trailing twelve months to June 2024).
The 'return' is the yearly profit. That means that for every €1 worth of shareholders' equity, the company generated €0.02 in profit.
What Is The Relationship Between ROE And Earnings Growth?
So far, we've learned that ROE is a measure of a company's profitability. Based on how much of its profits the company chooses to reinvest or "retain", we are then able to evaluate a company's future ability to generate profits. Generally speaking, other things being equal, firms with a high return on equity and profit retention, have a higher growth rate than firms that don’t share these attributes.
Acerinox's Earnings Growth And 2.0% ROE
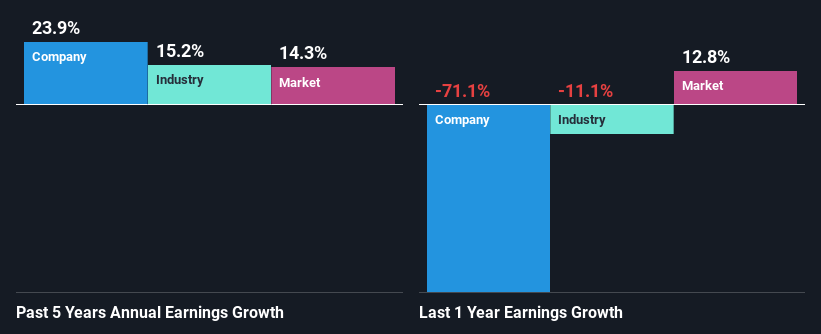
It is quite clear that Acerinox's ROE is rather low. Even when compared to the industry average of 8.9%, the ROE figure is pretty disappointing. Despite this, surprisingly, Acerinox saw an exceptional 24% net income growth over the past five years. Therefore, there could be other reasons behind this growth. For example, it is possible that the company's management has made some good strategic decisions, or that the company has a low payout ratio.
As a next step, we compared Acerinox's net income growth with the industry, and pleasingly, we found that the growth seen by the company is higher than the average industry growth of 15%.
The basis for attaching value to a company is, to a great extent, tied to its earnings growth. It’s important for an investor to know whether the market has priced in the company's expected earnings growth (or decline). This then helps them determine if the stock is placed for a bright or bleak future. If you're wondering about Acerinox's's valuation, check out this gauge of its price-to-earnings ratio, as compared to its industry.
Is Acerinox Efficiently Re-investing Its Profits?
Acerinox's significant three-year median payout ratio of 64% (where it is retaining only 36% of its income) suggests that the company has been able to achieve a high growth in earnings despite returning most of its income to shareholders.
Besides, Acerinox has been paying dividends over a period of seven years. This shows that the company is committed to sharing profits with its shareholders. Our latest analyst data shows that the future payout ratio of the company is expected to drop to 37% over the next three years. The fact that the company's ROE is expected to rise to 14% over the same period is explained by the drop in the payout ratio.
Summary
Overall, we feel that Acerinox certainly does have some positive factors to consider. That is, quite an impressive growth in earnings. However, the low profit retention means that the company's earnings growth could have been higher, had it been reinvesting a higher portion of its profits. Having said that, looking at the current analyst estimates, we found that the company's earnings are expected to gain momentum. To know more about the company's future earnings growth forecasts take a look at this free report on analyst forecasts for the company to find out more.
New: Manage All Your Stock Portfolios in One Place
We've created the ultimate portfolio companion for stock investors, and it's free.
• Connect an unlimited number of Portfolios and see your total in one currency
• Be alerted to new Warning Signs or Risks via email or mobile
• Track the Fair Value of your stocks
Have feedback on this article? Concerned about the content? Get in touch with us directly. Alternatively, email editorial-team (at) simplywallst.com.
This article by Simply Wall St is general in nature. We provide commentary based on historical data and analyst forecasts only using an unbiased methodology and our articles are not intended to be financial advice. It does not constitute a recommendation to buy or sell any stock, and does not take account of your objectives, or your financial situation. We aim to bring you long-term focused analysis driven by fundamental data. Note that our analysis may not factor in the latest price-sensitive company announcements or qualitative material. Simply Wall St has no position in any stocks mentioned.
About BME:ACX
Acerinox
Manufactures, process, and markets stainless steel products in Spain, the United States, Africa, Asia, Rest of Europe, and internationally.
Good value with reasonable growth potential.
Similar Companies
Market Insights


Advertisement
Community Narratives
For the Emperor: Why Games Workshop Could Be a Star Investment
Fair Value UK£160.00|0.1% overvalued
RO
Community Contributor
Securitas will boost margins with AI and tech-driven services
Fair Value SEK 260.91|44.5% undervalued
UN
Community Contributor
A Leader in EV Charging with Growth Potential
Fair Value €27.00|20.9% undervalued
TI
Community Contributor