An Intrinsic Calculation For Ebro Foods, S.A. (BME:EBRO) Suggests It's 29% Undervalued


Key Insights
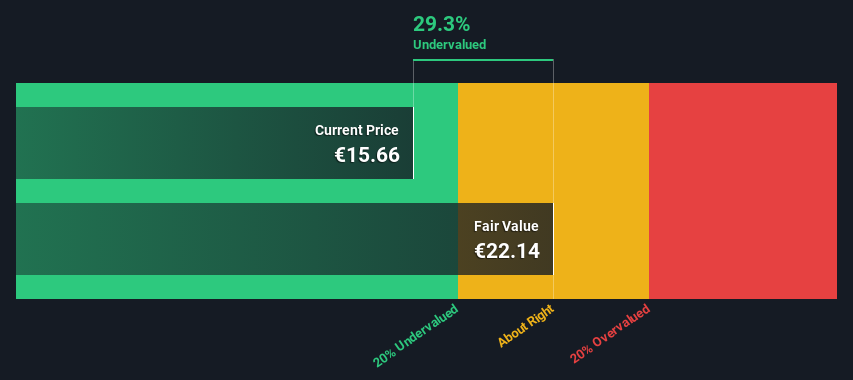
- The projected fair value for Ebro Foods is €22.14 based on 2 Stage Free Cash Flow to Equity
- Ebro Foods is estimated to be 29% undervalued based on current share price of €15.66
- The €19.81 analyst price target for EBRO is 11% less than our estimate of fair value
Does the June share price for Ebro Foods, S.A. (BME:EBRO) reflect what it's really worth? Today, we will estimate the stock's intrinsic value by taking the expected future cash flows and discounting them to their present value. We will take advantage of the Discounted Cash Flow (DCF) model for this purpose. There's really not all that much to it, even though it might appear quite complex.
We would caution that there are many ways of valuing a company and, like the DCF, each technique has advantages and disadvantages in certain scenarios. For those who are keen learners of equity analysis, the Simply Wall St analysis model here may be something of interest to you.
View our latest analysis for Ebro Foods
Crunching The Numbers
We're using the 2-stage growth model, which simply means we take in account two stages of company's growth. In the initial period the company may have a higher growth rate and the second stage is usually assumed to have a stable growth rate. In the first stage we need to estimate the cash flows to the business over the next ten years. Where possible we use analyst estimates, but when these aren't available we extrapolate the previous free cash flow (FCF) from the last estimate or reported value. We assume companies with shrinking free cash flow will slow their rate of shrinkage, and that companies with growing free cash flow will see their growth rate slow, over this period. We do this to reflect that growth tends to slow more in the early years than it does in later years.
Generally we assume that a dollar today is more valuable than a dollar in the future, so we need to discount the sum of these future cash flows to arrive at a present value estimate:
10-year free cash flow (FCF) estimate
| 2024 | 2025 | 2026 | 2027 | 2028 | 2029 | 2030 | 2031 | 2032 | 2033 | |
| Levered FCF (€, Millions) | €102.7m | €205.7m | €217.9m | €204.0m | €210.0m | €210.9m | €212.5m | €214.6m | €217.1m | €219.9m |
| Growth Rate Estimate Source | Analyst x3 | Analyst x6 | Analyst x5 | Analyst x1 | Analyst x1 | Est @ 0.43% | Est @ 0.76% | Est @ 1.00% | Est @ 1.16% | Est @ 1.27% |
| Present Value (€, Millions) Discounted @ 7.1% | €95.9 | €179 | €177 | €155 | €149 | €140 | €132 | €124 | €117 | €111 |
("Est" = FCF growth rate estimated by Simply Wall St)
Present Value of 10-year Cash Flow (PVCF) = €1.4b
After calculating the present value of future cash flows in the initial 10-year period, we need to calculate the Terminal Value, which accounts for all future cash flows beyond the first stage. The Gordon Growth formula is used to calculate Terminal Value at a future annual growth rate equal to the 5-year average of the 10-year government bond yield of 1.5%. We discount the terminal cash flows to today's value at a cost of equity of 7.1%.
Terminal Value (TV)= FCF2033 × (1 + g) ÷ (r – g) = €220m× (1 + 1.5%) ÷ (7.1%– 1.5%) = €4.0b
Present Value of Terminal Value (PVTV)= TV / (1 + r)10= €4.0b÷ ( 1 + 7.1%)10= €2.0b
The total value is the sum of cash flows for the next ten years plus the discounted terminal value, which results in the Total Equity Value, which in this case is €3.4b. In the final step we divide the equity value by the number of shares outstanding. Compared to the current share price of €15.7, the company appears a touch undervalued at a 29% discount to where the stock price trades currently. The assumptions in any calculation have a big impact on the valuation, so it is better to view this as a rough estimate, not precise down to the last cent.
Important Assumptions
We would point out that the most important inputs to a discounted cash flow are the discount rate and of course the actual cash flows. If you don't agree with these result, have a go at the calculation yourself and play with the assumptions. The DCF also does not consider the possible cyclicality of an industry, or a company's future capital requirements, so it does not give a full picture of a company's potential performance. Given that we are looking at Ebro Foods as potential shareholders, the cost of equity is used as the discount rate, rather than the cost of capital (or weighted average cost of capital, WACC) which accounts for debt. In this calculation we've used 7.1%, which is based on a levered beta of 0.800. Beta is a measure of a stock's volatility, compared to the market as a whole. We get our beta from the industry average beta of globally comparable companies, with an imposed limit between 0.8 and 2.0, which is a reasonable range for a stable business.
SWOT Analysis for Ebro Foods
- Earnings growth over the past year exceeded the industry.
- Debt is not viewed as a risk.
- Dividends are covered by earnings and cash flows.
- Dividend is low compared to the top 25% of dividend payers in the Food market.
- Annual earnings are forecast to grow for the next 3 years.
- Good value based on P/E ratio and estimated fair value.
- Annual earnings are forecast to grow slower than the Spanish market.
Looking Ahead:
Although the valuation of a company is important, it ideally won't be the sole piece of analysis you scrutinize for a company. DCF models are not the be-all and end-all of investment valuation. Preferably you'd apply different cases and assumptions and see how they would impact the company's valuation. For instance, if the terminal value growth rate is adjusted slightly, it can dramatically alter the overall result. Can we work out why the company is trading at a discount to intrinsic value? For Ebro Foods, there are three relevant elements you should consider:
- Risks: For instance, we've identified 1 warning sign for Ebro Foods that you should be aware of.
- Future Earnings: How does EBRO's growth rate compare to its peers and the wider market? Dig deeper into the analyst consensus number for the upcoming years by interacting with our free analyst growth expectation chart.
- Other High Quality Alternatives: Do you like a good all-rounder? Explore our interactive list of high quality stocks to get an idea of what else is out there you may be missing!
PS. Simply Wall St updates its DCF calculation for every Spanish stock every day, so if you want to find the intrinsic value of any other stock just search here.
Valuation is complex, but we're here to simplify it.
Discover if Ebro Foods might be undervalued or overvalued with our detailed analysis, featuring fair value estimates, potential risks, dividends, insider trades, and its financial condition.
Access Free AnalysisHave feedback on this article? Concerned about the content? Get in touch with us directly. Alternatively, email editorial-team (at) simplywallst.com.
This article by Simply Wall St is general in nature. We provide commentary based on historical data and analyst forecasts only using an unbiased methodology and our articles are not intended to be financial advice. It does not constitute a recommendation to buy or sell any stock, and does not take account of your objectives, or your financial situation. We aim to bring you long-term focused analysis driven by fundamental data. Note that our analysis may not factor in the latest price-sensitive company announcements or qualitative material. Simply Wall St has no position in any stocks mentioned.
Have feedback on this article? Concerned about the content? Get in touch with us directly. Alternatively, email editorial-team@simplywallst.com
About BME:EBRO
Ebro Foods
Operates as a food company in Spain, rest of Europe, the United States, Canada, and internationally.
Very undervalued with flawless balance sheet and pays a dividend.
Similar Companies
Market Insights

Community Narratives


