- Spain
- /
- Hospitality
- /
- BME:AMS
Amadeus IT Group (BME:AMS) shareholders have earned a 7.9% CAGR over the last three years


Low-cost index funds make it easy to achieve average market returns. But in any diversified portfolio of stocks, you'll see some that fall short of the average. That's what has happened with the Amadeus IT Group, S.A. (BME:AMS) share price. It's up 23% over three years, but that is below the market return. In the last year the stock price gained, albeit only 1.4%.
With that in mind, it's worth seeing if the company's underlying fundamentals have been the driver of long term performance, or if there are some discrepancies.
Check out our latest analysis for Amadeus IT Group
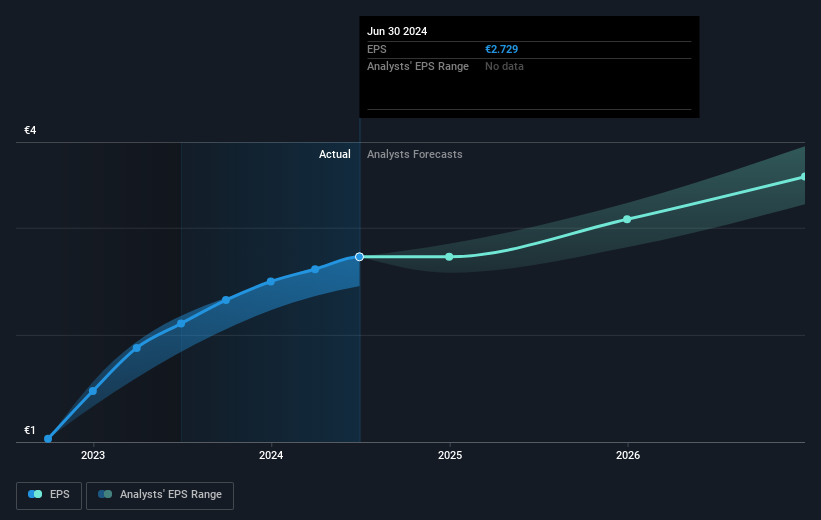
While markets are a powerful pricing mechanism, share prices reflect investor sentiment, not just underlying business performance. One way to examine how market sentiment has changed over time is to look at the interaction between a company's share price and its earnings per share (EPS).
During three years of share price growth, Amadeus IT Group moved from a loss to profitability. So we would expect a higher share price over the period.
You can see below how EPS has changed over time (discover the exact values by clicking on the image).
It's probably worth noting that the CEO is paid less than the median at similar sized companies. But while CEO remuneration is always worth checking, the really important question is whether the company can grow earnings going forward. Before buying or selling a stock, we always recommend a close examination of historic growth trends, available here..
What About Dividends?
It is important to consider the total shareholder return, as well as the share price return, for any given stock. The TSR incorporates the value of any spin-offs or discounted capital raisings, along with any dividends, based on the assumption that the dividends are reinvested. Arguably, the TSR gives a more comprehensive picture of the return generated by a stock. As it happens, Amadeus IT Group's TSR for the last 3 years was 26%, which exceeds the share price return mentioned earlier. This is largely a result of its dividend payments!
A Different Perspective
Amadeus IT Group shareholders are up 3.0% for the year (even including dividends). But that was short of the market average. On the bright side, that's still a gain, and it is certainly better than the yearly loss of about 0.6% endured over half a decade. It could well be that the business is stabilizing. I find it very interesting to look at share price over the long term as a proxy for business performance. But to truly gain insight, we need to consider other information, too. Consider for instance, the ever-present spectre of investment risk. We've identified 2 warning signs with Amadeus IT Group , and understanding them should be part of your investment process.
Of course Amadeus IT Group may not be the best stock to buy. So you may wish to see this free collection of growth stocks.
Please note, the market returns quoted in this article reflect the market weighted average returns of stocks that currently trade on Spanish exchanges.
New: Manage All Your Stock Portfolios in One Place
We've created the ultimate portfolio companion for stock investors, and it's free.
• Connect an unlimited number of Portfolios and see your total in one currency
• Be alerted to new Warning Signs or Risks via email or mobile
• Track the Fair Value of your stocks
Have feedback on this article? Concerned about the content? Get in touch with us directly. Alternatively, email editorial-team (at) simplywallst.com.
This article by Simply Wall St is general in nature. We provide commentary based on historical data and analyst forecasts only using an unbiased methodology and our articles are not intended to be financial advice. It does not constitute a recommendation to buy or sell any stock, and does not take account of your objectives, or your financial situation. We aim to bring you long-term focused analysis driven by fundamental data. Note that our analysis may not factor in the latest price-sensitive company announcements or qualitative material. Simply Wall St has no position in any stocks mentioned.
About BME:AMS
Amadeus IT Group
Operates as a transaction processor for the travel and tourism industry worldwide.
Reasonable growth potential with proven track record.
Similar Companies
Market Insights

Community Narratives

