- Denmark
- /
- Marine and Shipping
- /
- CPSE:MAERSK B
Slammed 25% A.P. Møller - Mærsk A/S (CPH:MAERSK B) Screens Well Here But There Might Be A Catch

A.P. Møller - Mærsk A/S (CPH:MAERSK B) shares have had a horrible month, losing 25% after a relatively good period beforehand. The drop over the last 30 days has capped off a tough year for shareholders, with the share price down 42% in that time.
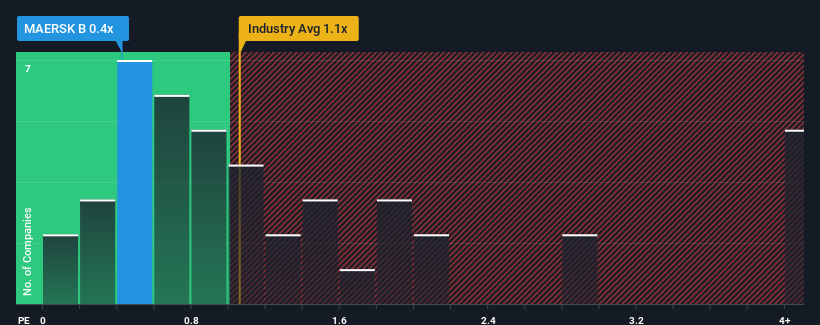
Since its price has dipped substantially, given about half the companies operating in Denmark's Shipping industry have price-to-sales ratios (or "P/S") above 1.1x, you may consider A.P. Møller - Mærsk as an attractive investment with its 0.4x P/S ratio. Although, it's not wise to just take the P/S at face value as there may be an explanation why it's limited.
See our latest analysis for A.P. Møller - Mærsk

How Has A.P. Møller - Mærsk Performed Recently?
Recent times haven't been great for A.P. Møller - Mærsk as its revenue has been falling quicker than most other companies. The P/S ratio is probably low because investors think this poor revenue performance isn't going to improve at all. So while you could say the stock is cheap, investors will be looking for improvement before they see it as good value. Or at the very least, you'd be hoping the revenue slide doesn't get any worse if your plan is to pick up some stock while it's out of favour.
Keen to find out how analysts think A.P. Møller - Mærsk's future stacks up against the industry? In that case, our free report is a great place to start.What Are Revenue Growth Metrics Telling Us About The Low P/S?
A.P. Møller - Mærsk's P/S ratio would be typical for a company that's only expected to deliver limited growth, and importantly, perform worse than the industry.
In reviewing the last year of financials, we were disheartened to see the company's revenues fell to the tune of 37%. This has soured the latest three-year period, which nevertheless managed to deliver a decent 28% overall rise in revenue. Although it's been a bumpy ride, it's still fair to say the revenue growth recently has been mostly respectable for the company.
Looking ahead now, revenue is anticipated to slump, contracting by 0.2% per year during the coming three years according to the analysts following the company. With the rest of the industry predicted to shrink by 0.7% per annum, it's set to post a similar result.
With this information, it's perhaps strange but not a major surprise that A.P. Møller - Mærsk is trading at a lower P/S in comparison. With revenue going in reverse, it's not guaranteed that the P/S has found a floor yet. There's potential for the P/S to fall to even lower levels if the company doesn't improve its top-line growth.
What Does A.P. Møller - Mærsk's P/S Mean For Investors?
A.P. Møller - Mærsk's recently weak share price has pulled its P/S back below other Shipping companies. Generally, our preference is to limit the use of the price-to-sales ratio to establishing what the market thinks about the overall health of a company.
Our examination of A.P. Møller - Mærsk's analyst forecasts revealed despite having an equally shaky outlook against the industry, its P/S much lower than we would have predicted. There could be some further unobserved threats to revenue stability preventing the P/S ratio from matching the outlook. Perhaps there is some hesitation about the company's ability to resist further pain to its business from the broader industry turmoil. However, if you agree with the analysts' forecasts, you may be able to pick up the stock at an attractive price.
Plus, you should also learn about these 4 warning signs we've spotted with A.P. Møller - Mærsk (including 1 which shouldn't be ignored).
If strong companies turning a profit tickle your fancy, then you'll want to check out this free list of interesting companies that trade on a low P/E (but have proven they can grow earnings).
New: Manage All Your Stock Portfolios in One Place
We've created the ultimate portfolio companion for stock investors, and it's free.
• Connect an unlimited number of Portfolios and see your total in one currency
• Be alerted to new Warning Signs or Risks via email or mobile
• Track the Fair Value of your stocks
Have feedback on this article? Concerned about the content? Get in touch with us directly. Alternatively, email editorial-team (at) simplywallst.com.
This article by Simply Wall St is general in nature. We provide commentary based on historical data and analyst forecasts only using an unbiased methodology and our articles are not intended to be financial advice. It does not constitute a recommendation to buy or sell any stock, and does not take account of your objectives, or your financial situation. We aim to bring you long-term focused analysis driven by fundamental data. Note that our analysis may not factor in the latest price-sensitive company announcements or qualitative material. Simply Wall St has no position in any stocks mentioned.
About CPSE:MAERSK B
A.P. Møller - Mærsk
Operates as an integrated logistics company in Denmark and internationally.
Flawless balance sheet with solid track record and pays a dividend.
Similar Companies
Market Insights
Community Narratives


