
Advertisement

Key Insights
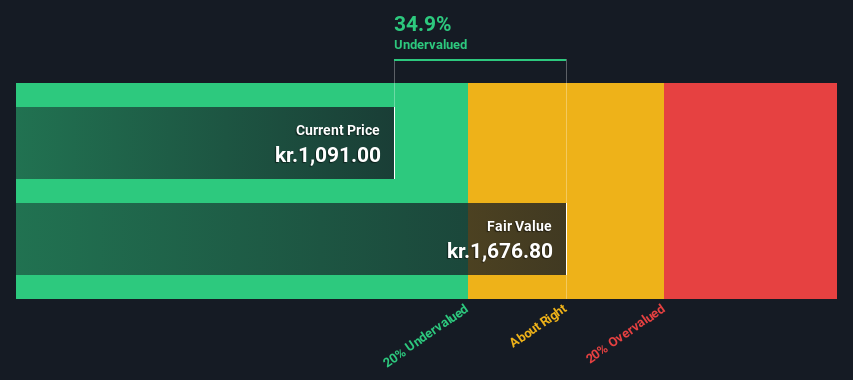
- DSV's estimated fair value is kr.1,677 based on 2 Stage Free Cash Flow to Equity
- DSV is estimated to be 35% undervalued based on current share price of kr.1,091
- Analyst price target for DSV is kr.1,459 which is 13% below our fair value estimate
Does the March share price for DSV A/S (CPH:DSV) reflect what it's really worth? Today, we will estimate the stock's intrinsic value by taking the expected future cash flows and discounting them to today's value. We will use the Discounted Cash Flow (DCF) model on this occasion. Before you think you won't be able to understand it, just read on! It's actually much less complex than you'd imagine.
We generally believe that a company's value is the present value of all of the cash it will generate in the future. However, a DCF is just one valuation metric among many, and it is not without flaws. If you want to learn more about discounted cash flow, the rationale behind this calculation can be read in detail in the Simply Wall St analysis model.
See our latest analysis for DSV
What's The Estimated Valuation?
We are going to use a two-stage DCF model, which, as the name states, takes into account two stages of growth. The first stage is generally a higher growth period which levels off heading towards the terminal value, captured in the second 'steady growth' period. To begin with, we have to get estimates of the next ten years of cash flows. Where possible we use analyst estimates, but when these aren't available we extrapolate the previous free cash flow (FCF) from the last estimate or reported value. We assume companies with shrinking free cash flow will slow their rate of shrinkage, and that companies with growing free cash flow will see their growth rate slow, over this period. We do this to reflect that growth tends to slow more in the early years than it does in later years.
Generally we assume that a dollar today is more valuable than a dollar in the future, and so the sum of these future cash flows is then discounted to today's value:
10-year free cash flow (FCF) estimate
| 2024 | 2025 | 2026 | 2027 | 2028 | 2029 | 2030 | 2031 | 2032 | 2033 | |
| Levered FCF (DKK, Millions) | kr.14.8b | kr.15.3b | kr.15.8b | kr.14.6b | kr.16.5b | kr.16.7b | kr.16.9b | kr.17.1b | kr.17.3b | kr.17.4b |
| Growth Rate Estimate Source | Analyst x4 | Analyst x4 | Analyst x4 | Analyst x2 | Analyst x1 | Est @ 1.38% | Est @ 1.20% | Est @ 1.08% | Est @ 0.99% | Est @ 0.92% |
| Present Value (DKK, Millions) Discounted @ 5.4% | kr.14.0k | kr.13.7k | kr.13.5k | kr.11.9k | kr.12.7k | kr.12.2k | kr.11.7k | kr.11.3k | kr.10.8k | kr.10.3k |
("Est" = FCF growth rate estimated by Simply Wall St)
Present Value of 10-year Cash Flow (PVCF) = kr.122b
After calculating the present value of future cash flows in the initial 10-year period, we need to calculate the Terminal Value, which accounts for all future cash flows beyond the first stage. The Gordon Growth formula is used to calculate Terminal Value at a future annual growth rate equal to the 5-year average of the 10-year government bond yield of 0.8%. We discount the terminal cash flows to today's value at a cost of equity of 5.4%.
Terminal Value (TV)= FCF2033 × (1 + g) ÷ (r – g) = kr.17b× (1 + 0.8%) ÷ (5.4%– 0.8%) = kr.383b
Present Value of Terminal Value (PVTV)= TV / (1 + r)10= kr.383b÷ ( 1 + 5.4%)10= kr.227b
The total value is the sum of cash flows for the next ten years plus the discounted terminal value, which results in the Total Equity Value, which in this case is kr.349b. The last step is to then divide the equity value by the number of shares outstanding. Compared to the current share price of kr.1.1k, the company appears quite undervalued at a 35% discount to where the stock price trades currently. Remember though, that this is just an approximate valuation, and like any complex formula - garbage in, garbage out.
Important Assumptions
The calculation above is very dependent on two assumptions. The first is the discount rate and the other is the cash flows. If you don't agree with these result, have a go at the calculation yourself and play with the assumptions. The DCF also does not consider the possible cyclicality of an industry, or a company's future capital requirements, so it does not give a full picture of a company's potential performance. Given that we are looking at DSV as potential shareholders, the cost of equity is used as the discount rate, rather than the cost of capital (or weighted average cost of capital, WACC) which accounts for debt. In this calculation we've used 5.4%, which is based on a levered beta of 0.998. Beta is a measure of a stock's volatility, compared to the market as a whole. We get our beta from the industry average beta of globally comparable companies, with an imposed limit between 0.8 and 2.0, which is a reasonable range for a stable business.
SWOT Analysis for DSV
Strength
- Debt is not viewed as a risk.
Weakness
- Earnings declined over the past year.
- Dividend is low compared to the top 25% of dividend payers in the Logistics market.
Opportunity
- Annual earnings are forecast to grow for the next 3 years.
- Good value based on P/E ratio and estimated fair value.
Threat
- Annual earnings are forecast to grow slower than the Danish market.
Next Steps:
Whilst important, the DCF calculation is only one of many factors that you need to assess for a company. It's not possible to obtain a foolproof valuation with a DCF model. Instead the best use for a DCF model is to test certain assumptions and theories to see if they would lead to the company being undervalued or overvalued. If a company grows at a different rate, or if its cost of equity or risk free rate changes sharply, the output can look very different. Can we work out why the company is trading at a discount to intrinsic value? For DSV, there are three essential items you should further research:
- Financial Health: Does DSV have a healthy balance sheet? Take a look at our free balance sheet analysis with six simple checks on key factors like leverage and risk.
- Future Earnings: How does DSV's growth rate compare to its peers and the wider market? Dig deeper into the analyst consensus number for the upcoming years by interacting with our free analyst growth expectation chart.
- Other High Quality Alternatives: Do you like a good all-rounder? Explore our interactive list of high quality stocks to get an idea of what else is out there you may be missing!
PS. Simply Wall St updates its DCF calculation for every Danish stock every day, so if you want to find the intrinsic value of any other stock just search here.
New: Manage All Your Stock Portfolios in One Place
We've created the ultimate portfolio companion for stock investors, and it's free.
• Connect an unlimited number of Portfolios and see your total in one currency
• Be alerted to new Warning Signs or Risks via email or mobile
• Track the Fair Value of your stocks
Have feedback on this article? Concerned about the content? Get in touch with us directly. Alternatively, email editorial-team (at) simplywallst.com.
This article by Simply Wall St is general in nature. We provide commentary based on historical data and analyst forecasts only using an unbiased methodology and our articles are not intended to be financial advice. It does not constitute a recommendation to buy or sell any stock, and does not take account of your objectives, or your financial situation. We aim to bring you long-term focused analysis driven by fundamental data. Note that our analysis may not factor in the latest price-sensitive company announcements or qualitative material. Simply Wall St has no position in any stocks mentioned.
About CPSE:DSV
DSV
Offers transport and logistics services in Europe, the Middle East, Africa, North America, South America, Asia, Australia, and the Pacific.
Reasonable growth potential with adequate balance sheet.
Similar Companies
Market Insights

Advertisement
Community Narratives
Enterprise, AI & Cloud Growth Ahead, Waiting For the Right Price 💸
Fair Value US$204.74|5.4% overvalued
FR
Community Contributor
Good foundation, but now it's all about the next steps
Fair Value US$147.87|28.9% undervalued
TO
Community Contributor
XTB's Path to 100–120 PLN by 2028 Amid Market Volatility
Fair Value zł100.96|36.6% undervalued
DZ
Community Contributor