

Key Insights
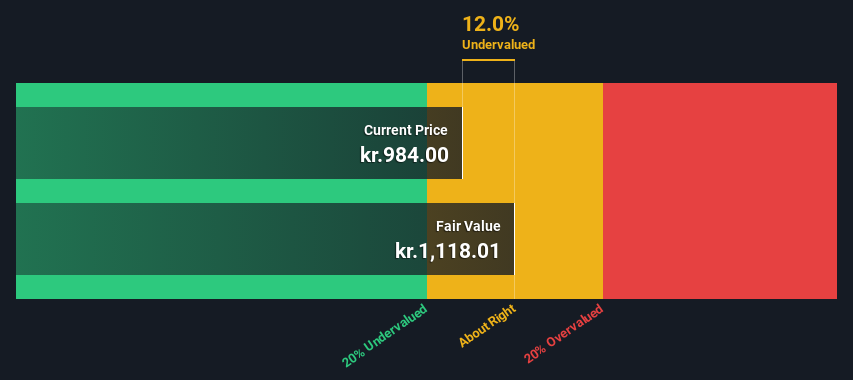
- Using the 2 Stage Free Cash Flow to Equity, Novo Nordisk fair value estimate is kr.1,118
- Novo Nordisk's kr.984 share price indicates it is trading at similar levels as its fair value estimate
- Our fair value estimate is 21% higher than Novo Nordisk's analyst price target of kr.921
Today we'll do a simple run through of a valuation method used to estimate the attractiveness of Novo Nordisk A/S (CPH:NOVO B) as an investment opportunity by taking the expected future cash flows and discounting them to their present value. The Discounted Cash Flow (DCF) model is the tool we will apply to do this. Don't get put off by the jargon, the math behind it is actually quite straightforward.
We generally believe that a company's value is the present value of all of the cash it will generate in the future. However, a DCF is just one valuation metric among many, and it is not without flaws. For those who are keen learners of equity analysis, the Simply Wall St analysis model here may be something of interest to you.
View our latest analysis for Novo Nordisk
Crunching The Numbers
We are going to use a two-stage DCF model, which, as the name states, takes into account two stages of growth. The first stage is generally a higher growth period which levels off heading towards the terminal value, captured in the second 'steady growth' period. To start off with, we need to estimate the next ten years of cash flows. Where possible we use analyst estimates, but when these aren't available we extrapolate the previous free cash flow (FCF) from the last estimate or reported value. We assume companies with shrinking free cash flow will slow their rate of shrinkage, and that companies with growing free cash flow will see their growth rate slow, over this period. We do this to reflect that growth tends to slow more in the early years than it does in later years.
A DCF is all about the idea that a dollar in the future is less valuable than a dollar today, so we need to discount the sum of these future cash flows to arrive at a present value estimate:
10-year free cash flow (FCF) estimate
| 2024 | 2025 | 2026 | 2027 | 2028 | 2029 | 2030 | 2031 | 2032 | 2033 | |
| Levered FCF (DKK, Millions) | kr.68.0b | kr.95.9b | kr.117.6b | kr.144.2b | kr.165.1b | kr.179.9b | kr.191.7b | kr.201.0b | kr.208.3b | kr.214.2b |
| Growth Rate Estimate Source | Analyst x10 | Analyst x10 | Analyst x10 | Analyst x5 | Analyst x5 | Est @ 8.96% | Est @ 6.54% | Est @ 4.85% | Est @ 3.66% | Est @ 2.83% |
| Present Value (DKK, Millions) Discounted @ 4.6% | kr.65.0k | kr.87.7k | kr.102.9k | kr.120.6k | kr.132.0k | kr.137.6k | kr.140.2k | kr.140.6k | kr.139.3k | kr.137.0k |
("Est" = FCF growth rate estimated by Simply Wall St)
Present Value of 10-year Cash Flow (PVCF) = kr.1.2t
The second stage is also known as Terminal Value, this is the business's cash flow after the first stage. For a number of reasons a very conservative growth rate is used that cannot exceed that of a country's GDP growth. In this case we have used the 5-year average of the 10-year government bond yield (0.9%) to estimate future growth. In the same way as with the 10-year 'growth' period, we discount future cash flows to today's value, using a cost of equity of 4.6%.
Terminal Value (TV)= FCF2033 × (1 + g) ÷ (r – g) = kr.214b× (1 + 0.9%) ÷ (4.6%– 0.9%) = kr.5.9t
Present Value of Terminal Value (PVTV)= TV / (1 + r)10= kr.5.9t÷ ( 1 + 4.6%)10= kr.3.8t
The total value is the sum of cash flows for the next ten years plus the discounted terminal value, which results in the Total Equity Value, which in this case is kr.5.0t. In the final step we divide the equity value by the number of shares outstanding. Compared to the current share price of kr.984, the company appears about fair value at a 12% discount to where the stock price trades currently. The assumptions in any calculation have a big impact on the valuation, so it is better to view this as a rough estimate, not precise down to the last cent.
The Assumptions
The calculation above is very dependent on two assumptions. The first is the discount rate and the other is the cash flows. If you don't agree with these result, have a go at the calculation yourself and play with the assumptions. The DCF also does not consider the possible cyclicality of an industry, or a company's future capital requirements, so it does not give a full picture of a company's potential performance. Given that we are looking at Novo Nordisk as potential shareholders, the cost of equity is used as the discount rate, rather than the cost of capital (or weighted average cost of capital, WACC) which accounts for debt. In this calculation we've used 4.6%, which is based on a levered beta of 0.800. Beta is a measure of a stock's volatility, compared to the market as a whole. We get our beta from the industry average beta of globally comparable companies, with an imposed limit between 0.8 and 2.0, which is a reasonable range for a stable business.
SWOT Analysis for Novo Nordisk
- Earnings growth over the past year exceeded the industry.
- Debt is not viewed as a risk.
- Dividend is low compared to the top 25% of dividend payers in the Pharmaceuticals market.
- Annual earnings are forecast to grow faster than the Danish market.
- Good value based on P/E ratio and estimated fair value.
- Revenue is forecast to grow slower than 20% per year.
Moving On:
Valuation is only one side of the coin in terms of building your investment thesis, and it is only one of many factors that you need to assess for a company. It's not possible to obtain a foolproof valuation with a DCF model. Preferably you'd apply different cases and assumptions and see how they would impact the company's valuation. If a company grows at a different rate, or if its cost of equity or risk free rate changes sharply, the output can look very different. For Novo Nordisk, we've compiled three additional aspects you should explore:
- Risks: We feel that you should assess the 2 warning signs for Novo Nordisk (1 is a bit unpleasant!) we've flagged before making an investment in the company.
- Future Earnings: How does NOVO B's growth rate compare to its peers and the wider market? Dig deeper into the analyst consensus number for the upcoming years by interacting with our free analyst growth expectation chart.
- Other High Quality Alternatives: Do you like a good all-rounder? Explore our interactive list of high quality stocks to get an idea of what else is out there you may be missing!
PS. Simply Wall St updates its DCF calculation for every Danish stock every day, so if you want to find the intrinsic value of any other stock just search here.
Valuation is complex, but we're here to simplify it.
Discover if Novo Nordisk might be undervalued or overvalued with our detailed analysis, featuring fair value estimates, potential risks, dividends, insider trades, and its financial condition.
Access Free AnalysisHave feedback on this article? Concerned about the content? Get in touch with us directly. Alternatively, email editorial-team (at) simplywallst.com.
This article by Simply Wall St is general in nature. We provide commentary based on historical data and analyst forecasts only using an unbiased methodology and our articles are not intended to be financial advice. It does not constitute a recommendation to buy or sell any stock, and does not take account of your objectives, or your financial situation. We aim to bring you long-term focused analysis driven by fundamental data. Note that our analysis may not factor in the latest price-sensitive company announcements or qualitative material. Simply Wall St has no position in any stocks mentioned.
About CPSE:NOVO B
Novo Nordisk
Engages in the research and development, manufacture, and distribution of pharmaceutical products in Europe, the Middle East, Africa, Mainland China, Hong Kong, Taiwan, North America, and internationally.
Reasonable growth potential with proven track record and pays a dividend.
